
Blog
I apologize for not updating the last few weeks. Monsters' activities have all started (Boy Scouts, Girl Scouts, Dance class, Dance Team, HipHop class, and Gymnastics), along with school, a tiny vacation (we saw dolphins on a whale watching tour in Dana Point, CA), and my Pop-Pop passing away (1935-2024).
Today, I'm running a suitability analysis on Neon Compass's home location area. We're based out of Henderson, NV, so I decided to only stick with Henderson for this one. For other companies that want to use the whole Valley, I can accommodate. (I'll show it in next week's blog post for a client)First, I created a 1-3-5-mile radius from 112 S. Water St (Launchpad for the Henderson Chamber of Commerce)
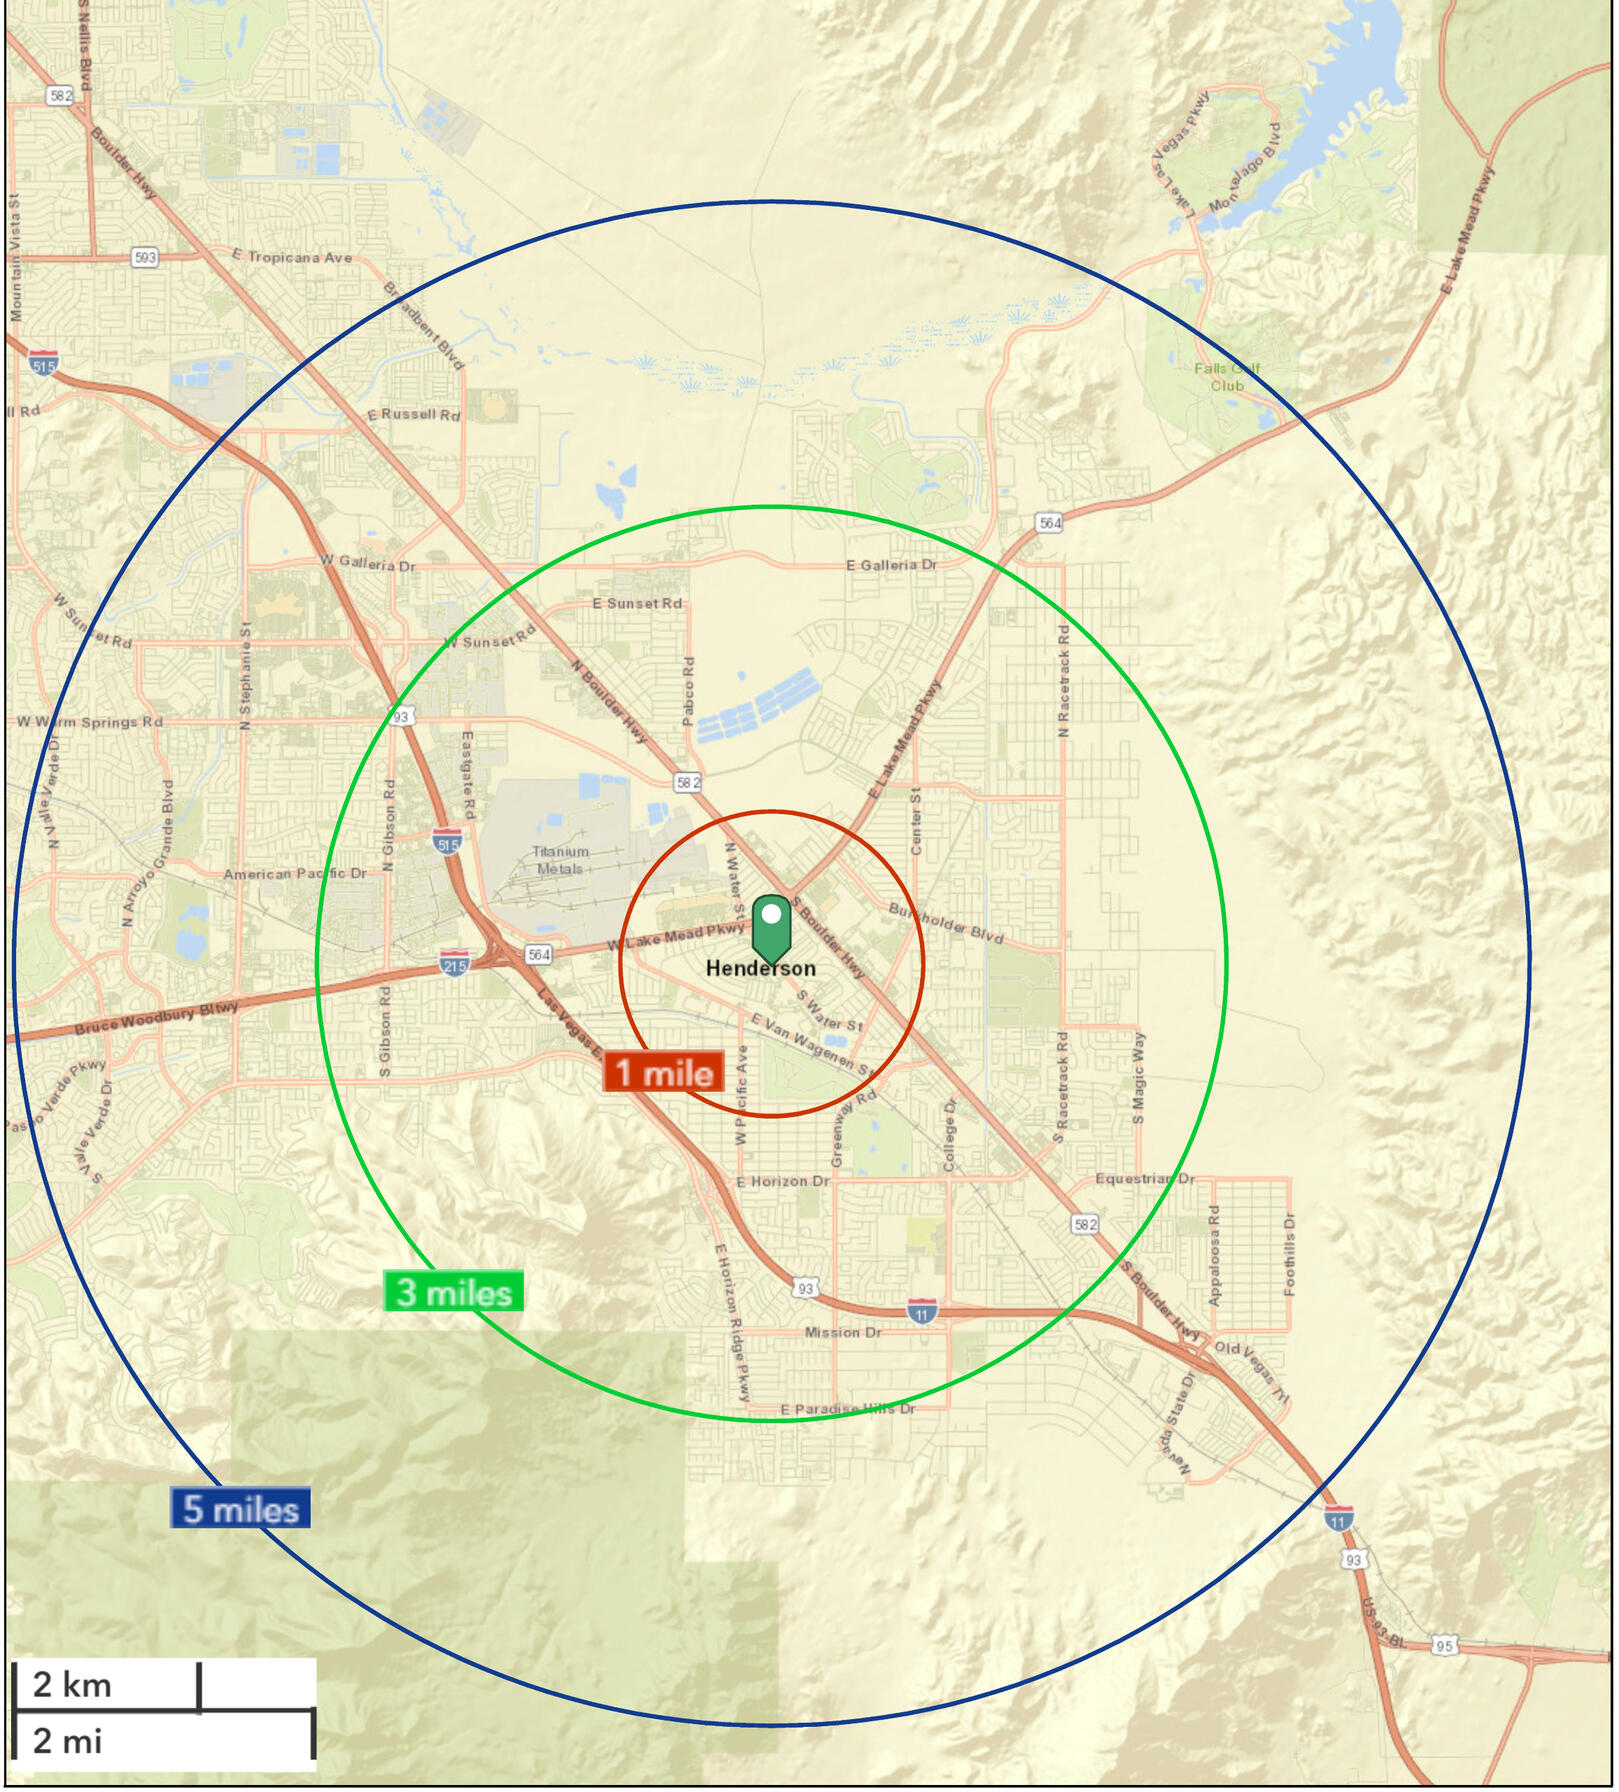
This gave me an idea of where I can target different clients. I’m a Business-to-Business map maker, so I only wanted to see the clients I’m looking for
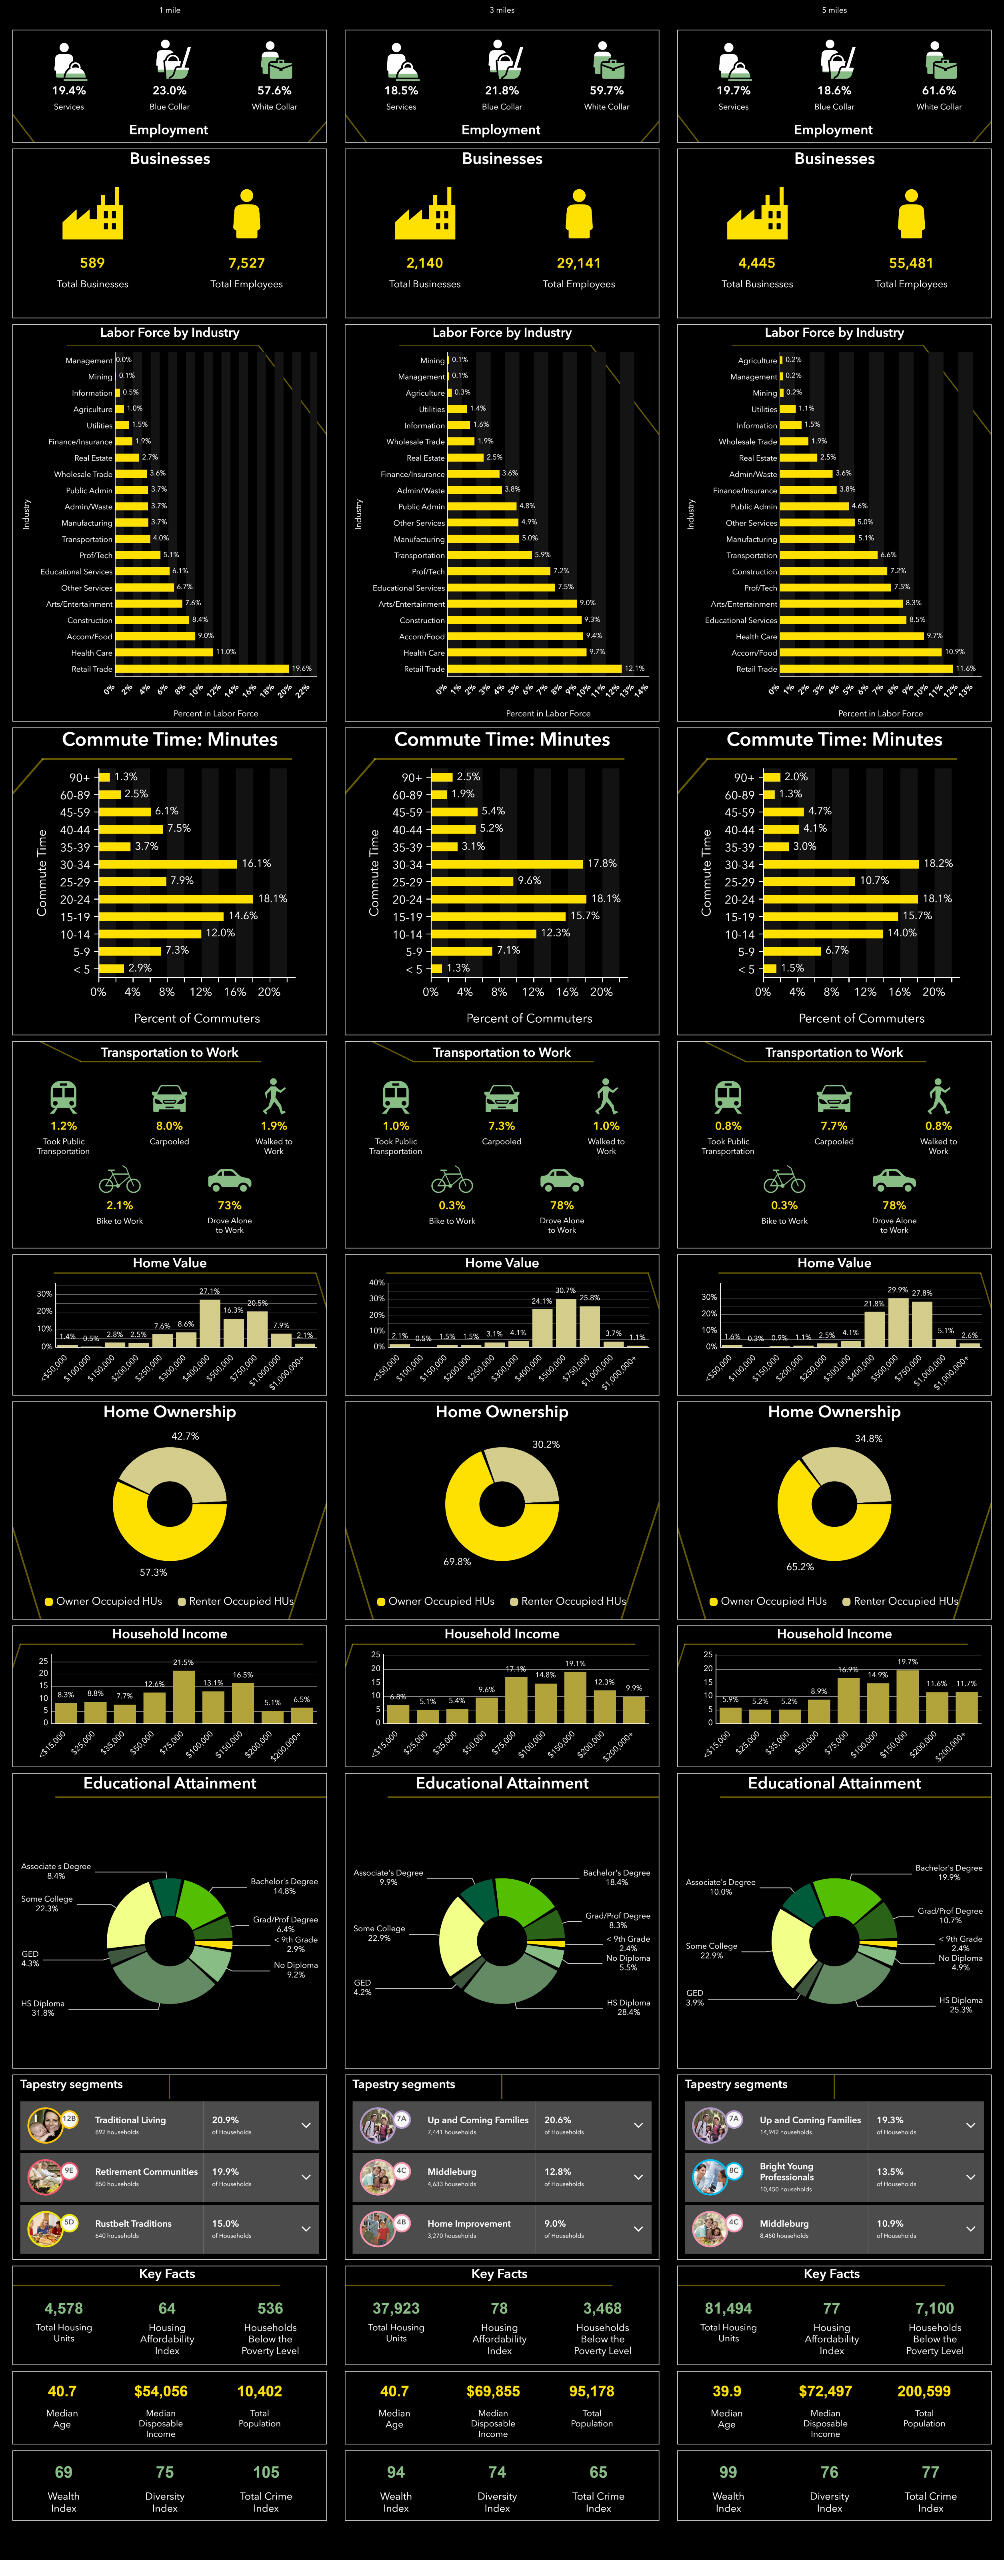
Second, I decided to go with Census Block groups (and I mislabeled that in the PDFs/PNGs as Tracts), since they are the smallest unit of measurement I can do for this kind of analysis. The blue lines are zip code boundaries, since I only wanted to target the Henderson area.

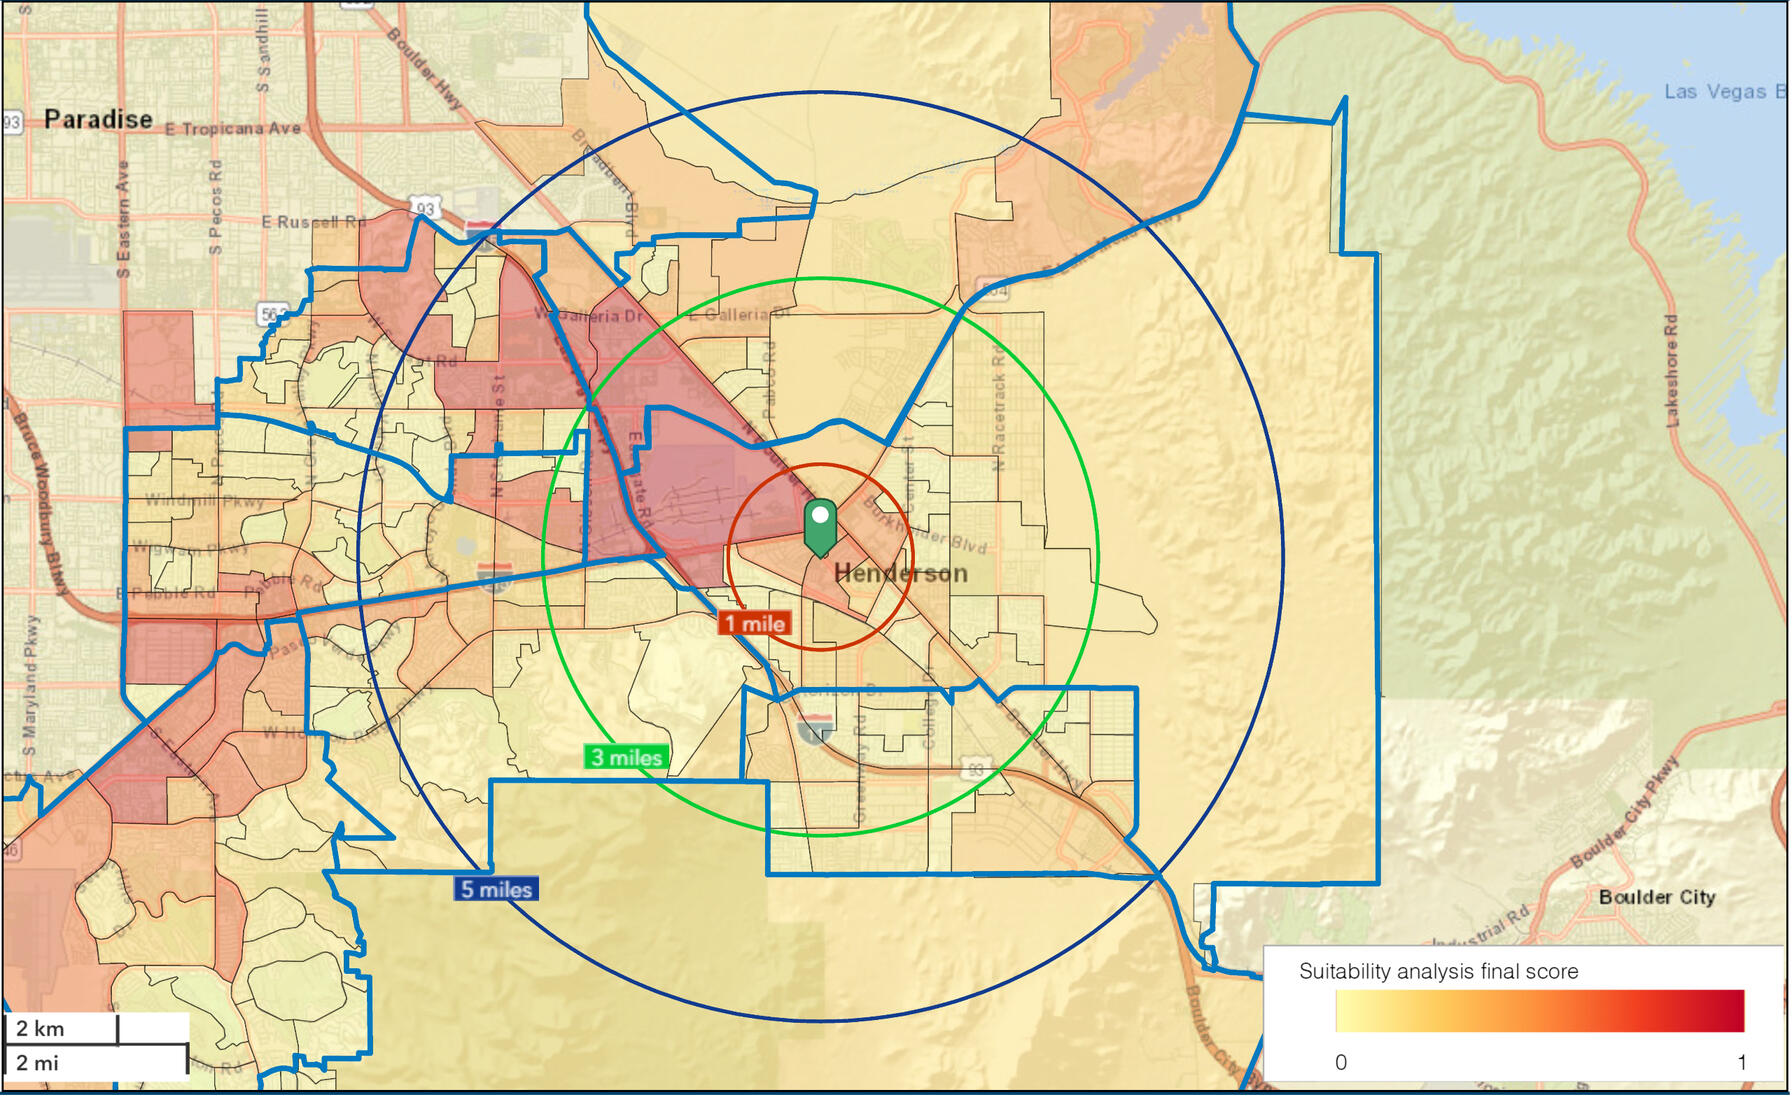
I changed it to 65% transparent, so that I can see the street information under the overlay.I focused on the top five of the census block groups, since those are the areas where I can scale my business easiest.

You might notice that the score and weighted score are the same number. That’s because I solely focused on business numbers. For clients who are finding customers, I would also add Households versus what kinds of customers they are looking for.
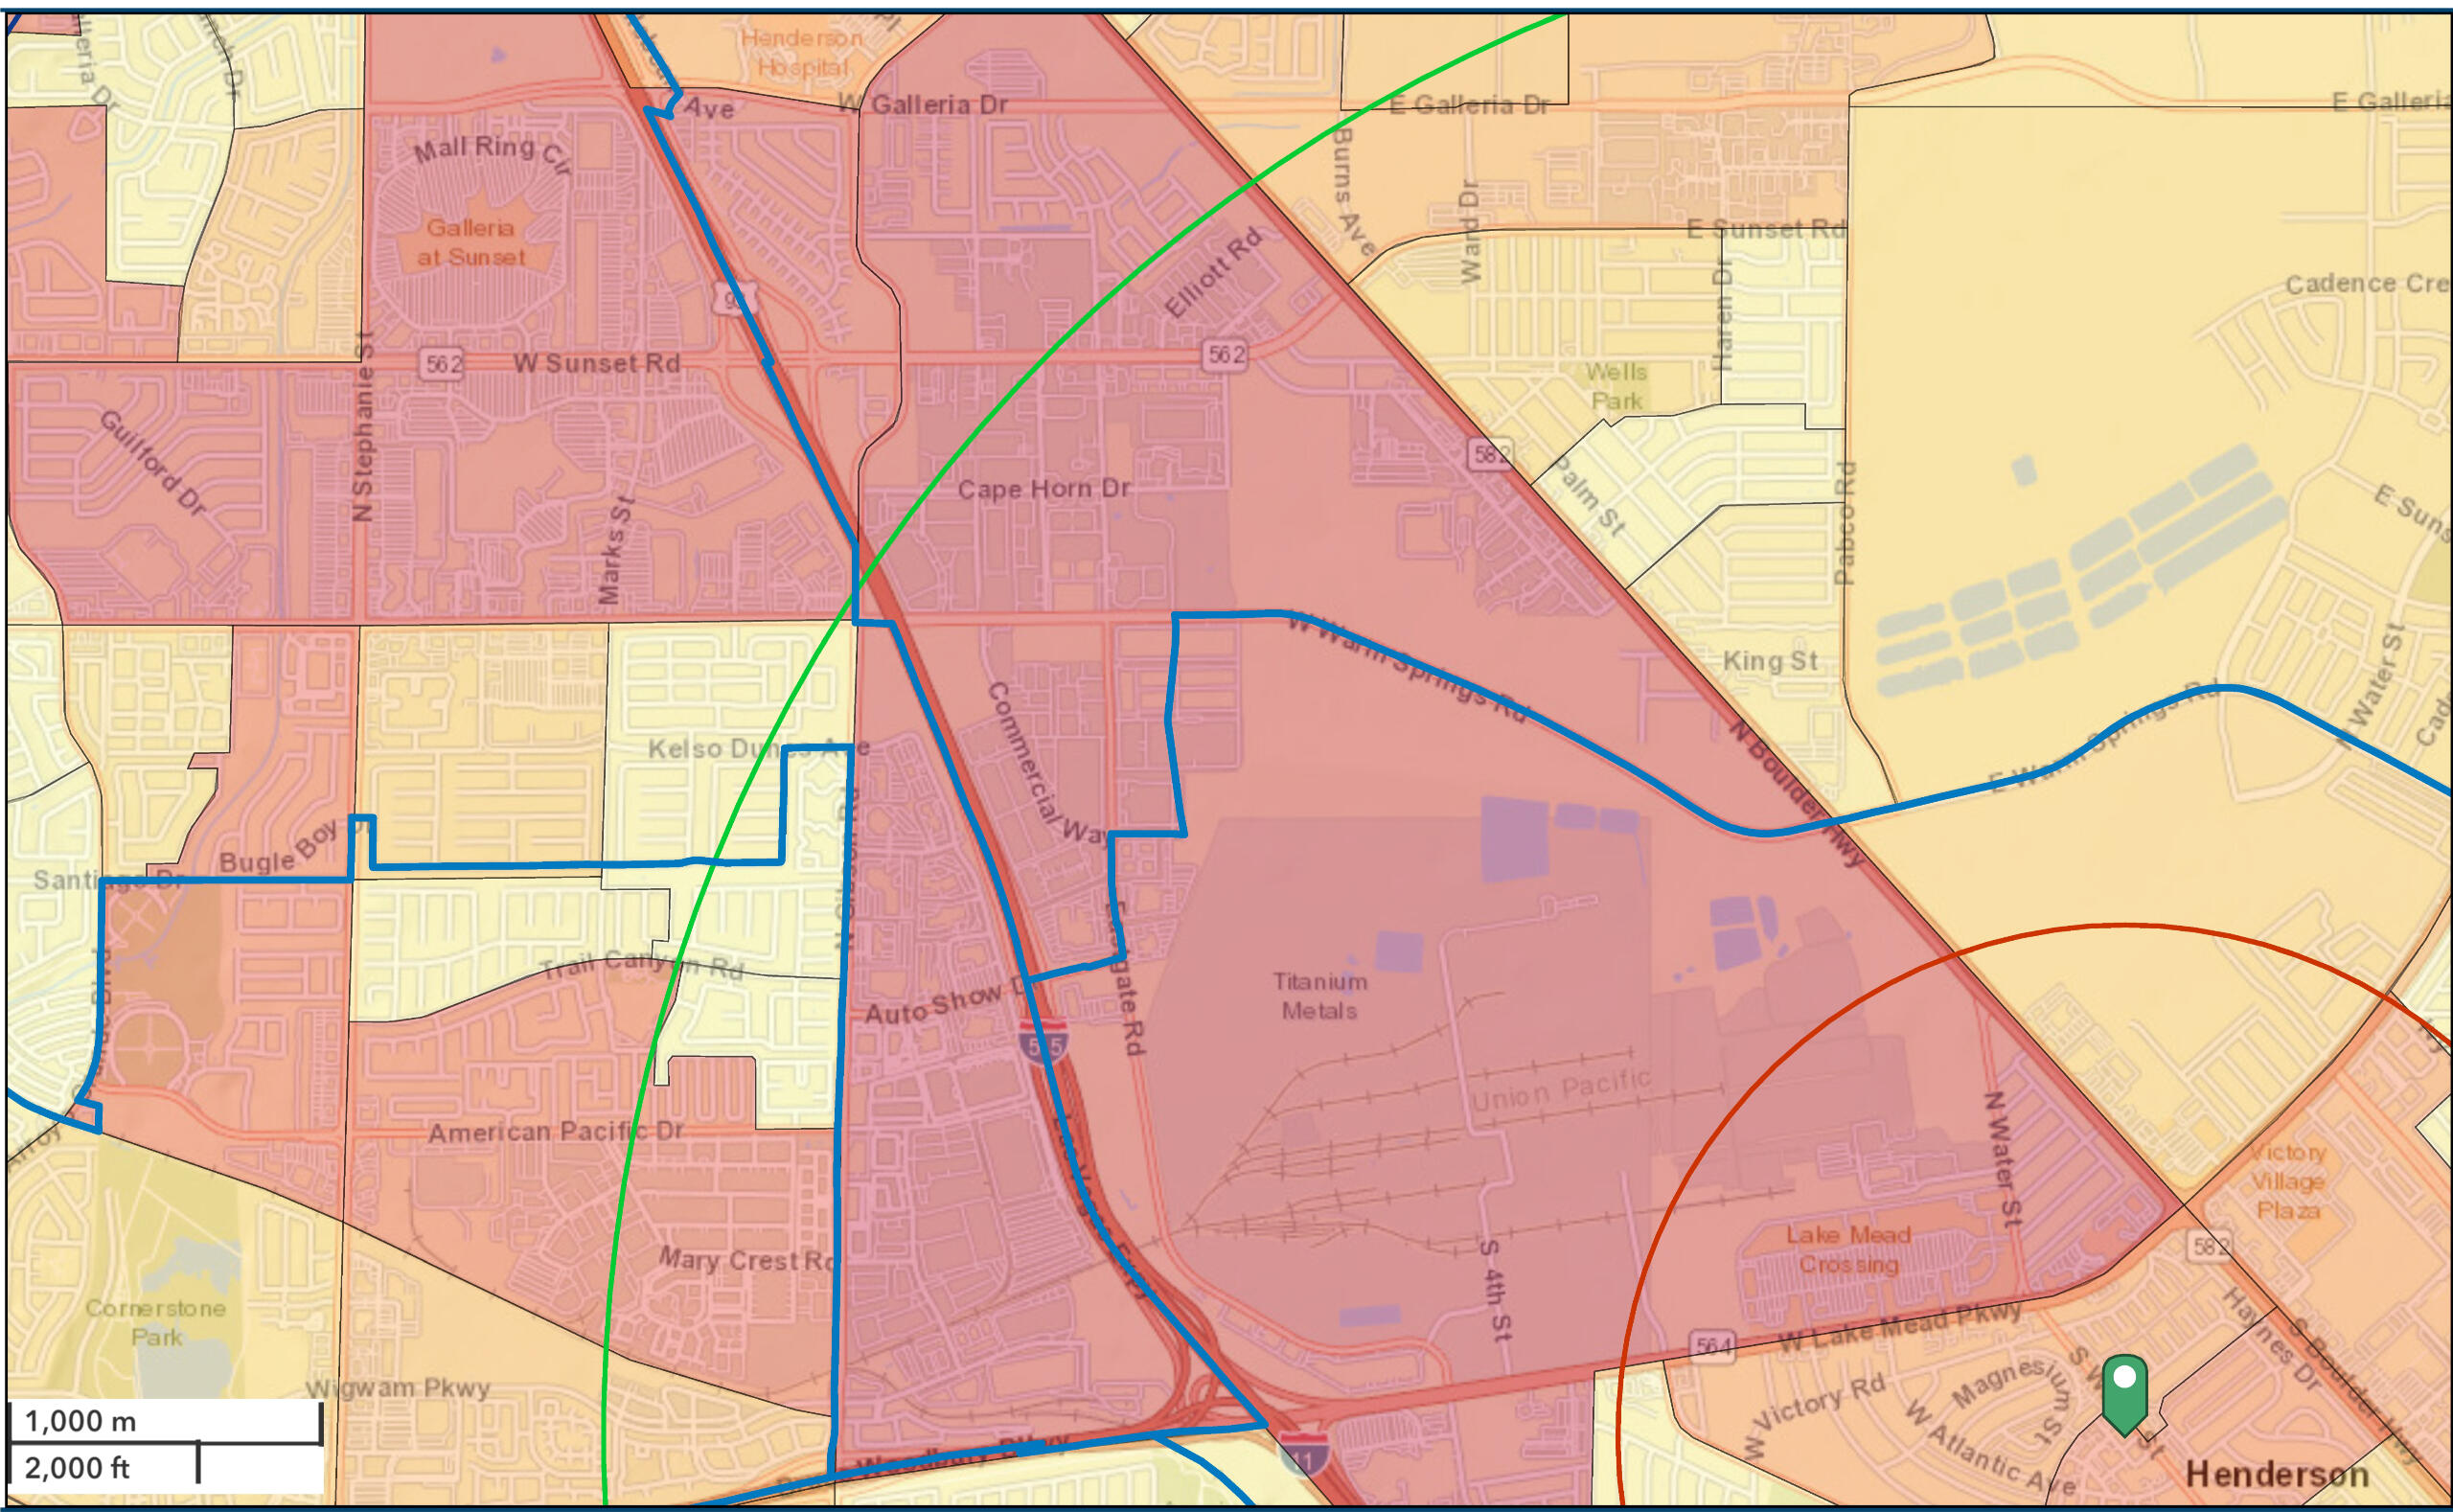
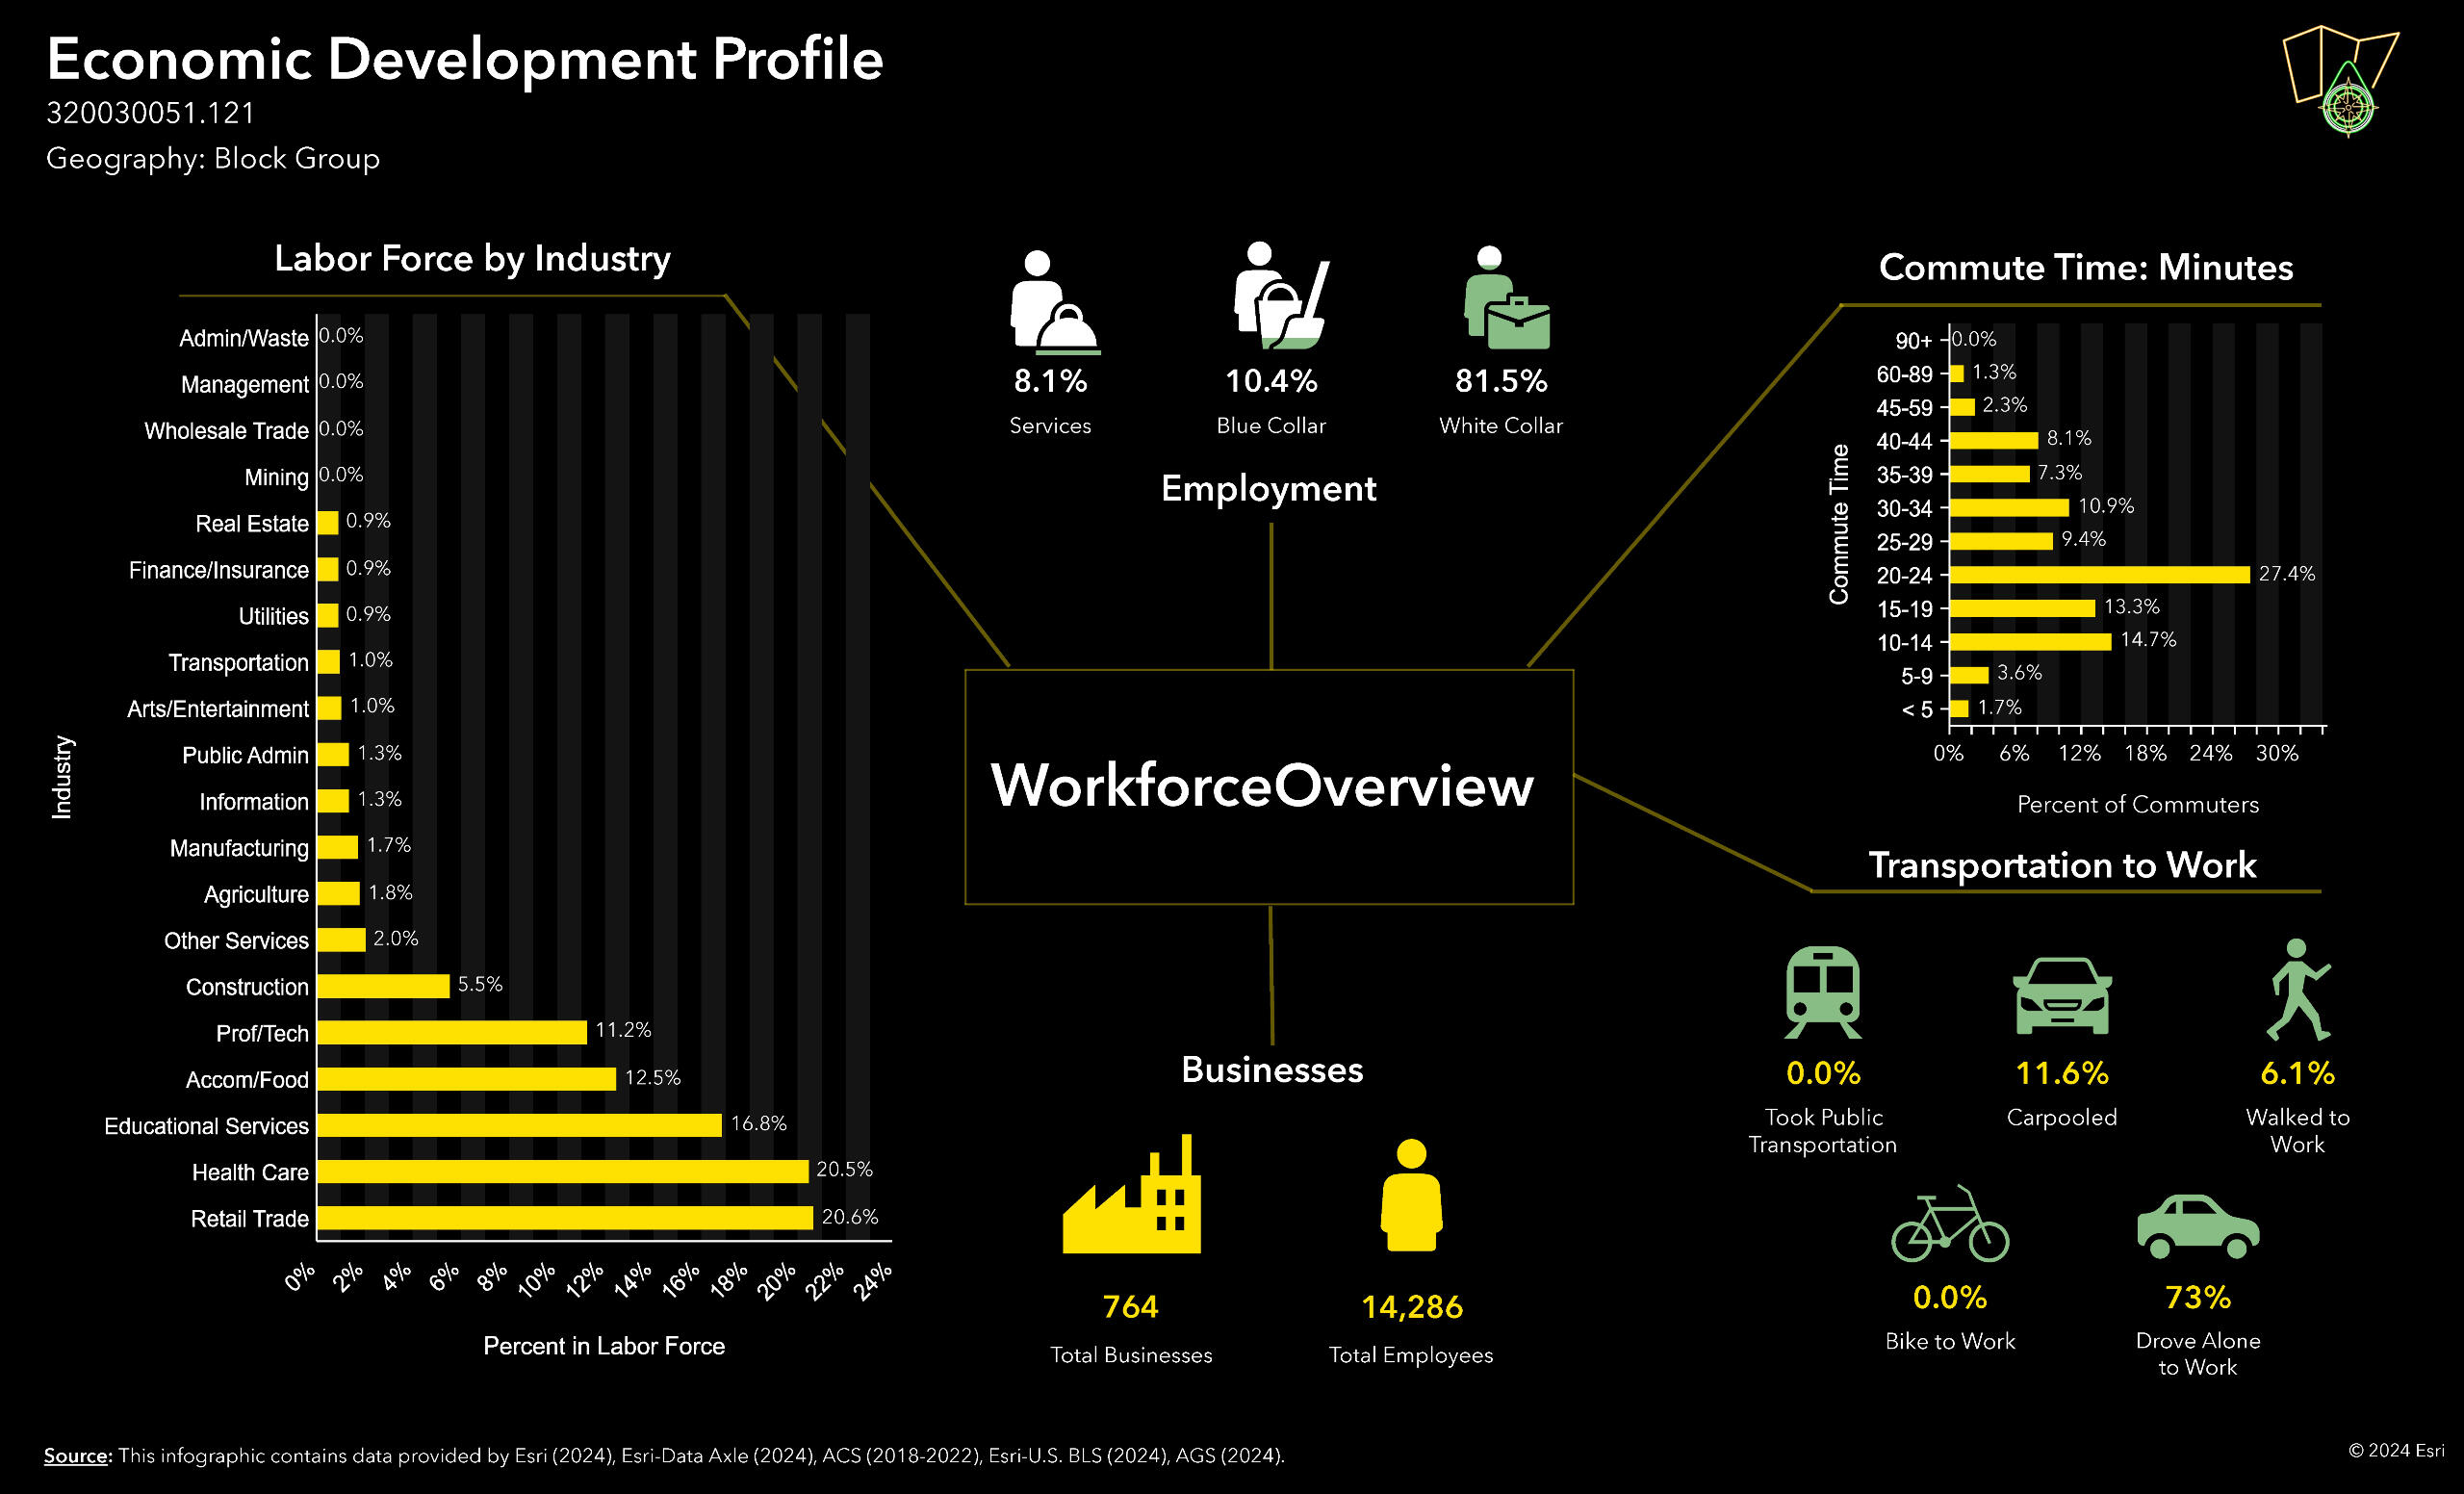
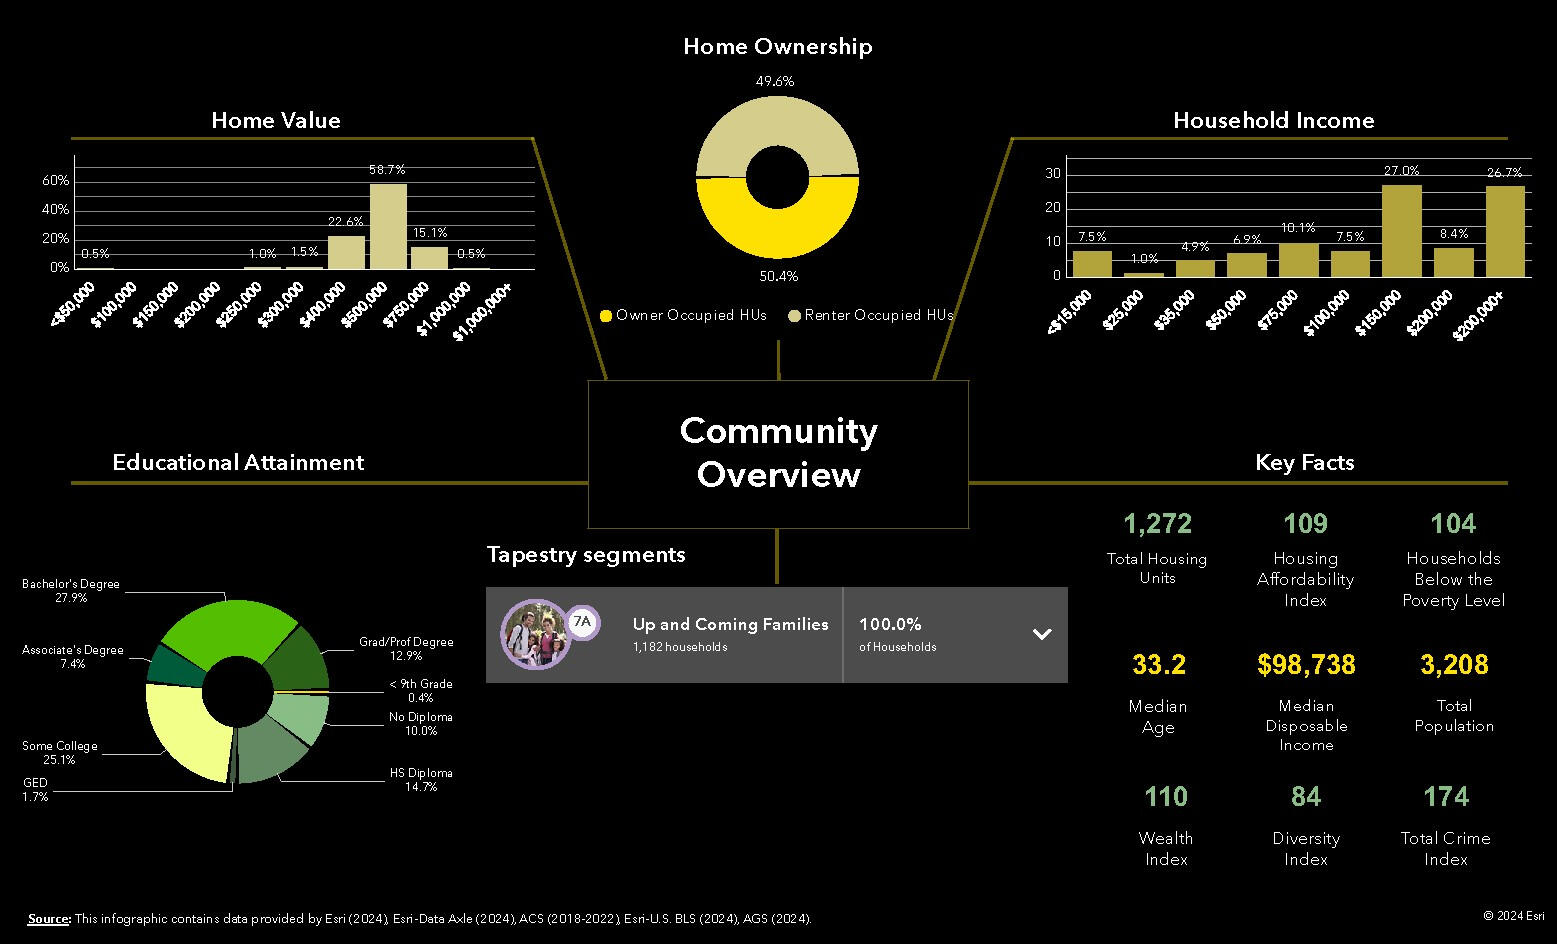
This is my top target area based on the number of businesses there (764 businesses). I prefer having the overlay semi-transparent, because most people don’t know what block group is where (I didn’t until I worked for the Census Bureau in 2019). This allows me to see cross and boundary streets.Next, I’ll run another analysis for each of the areas (I only did it for my top area, since I don’t want to waste credits on an example post)
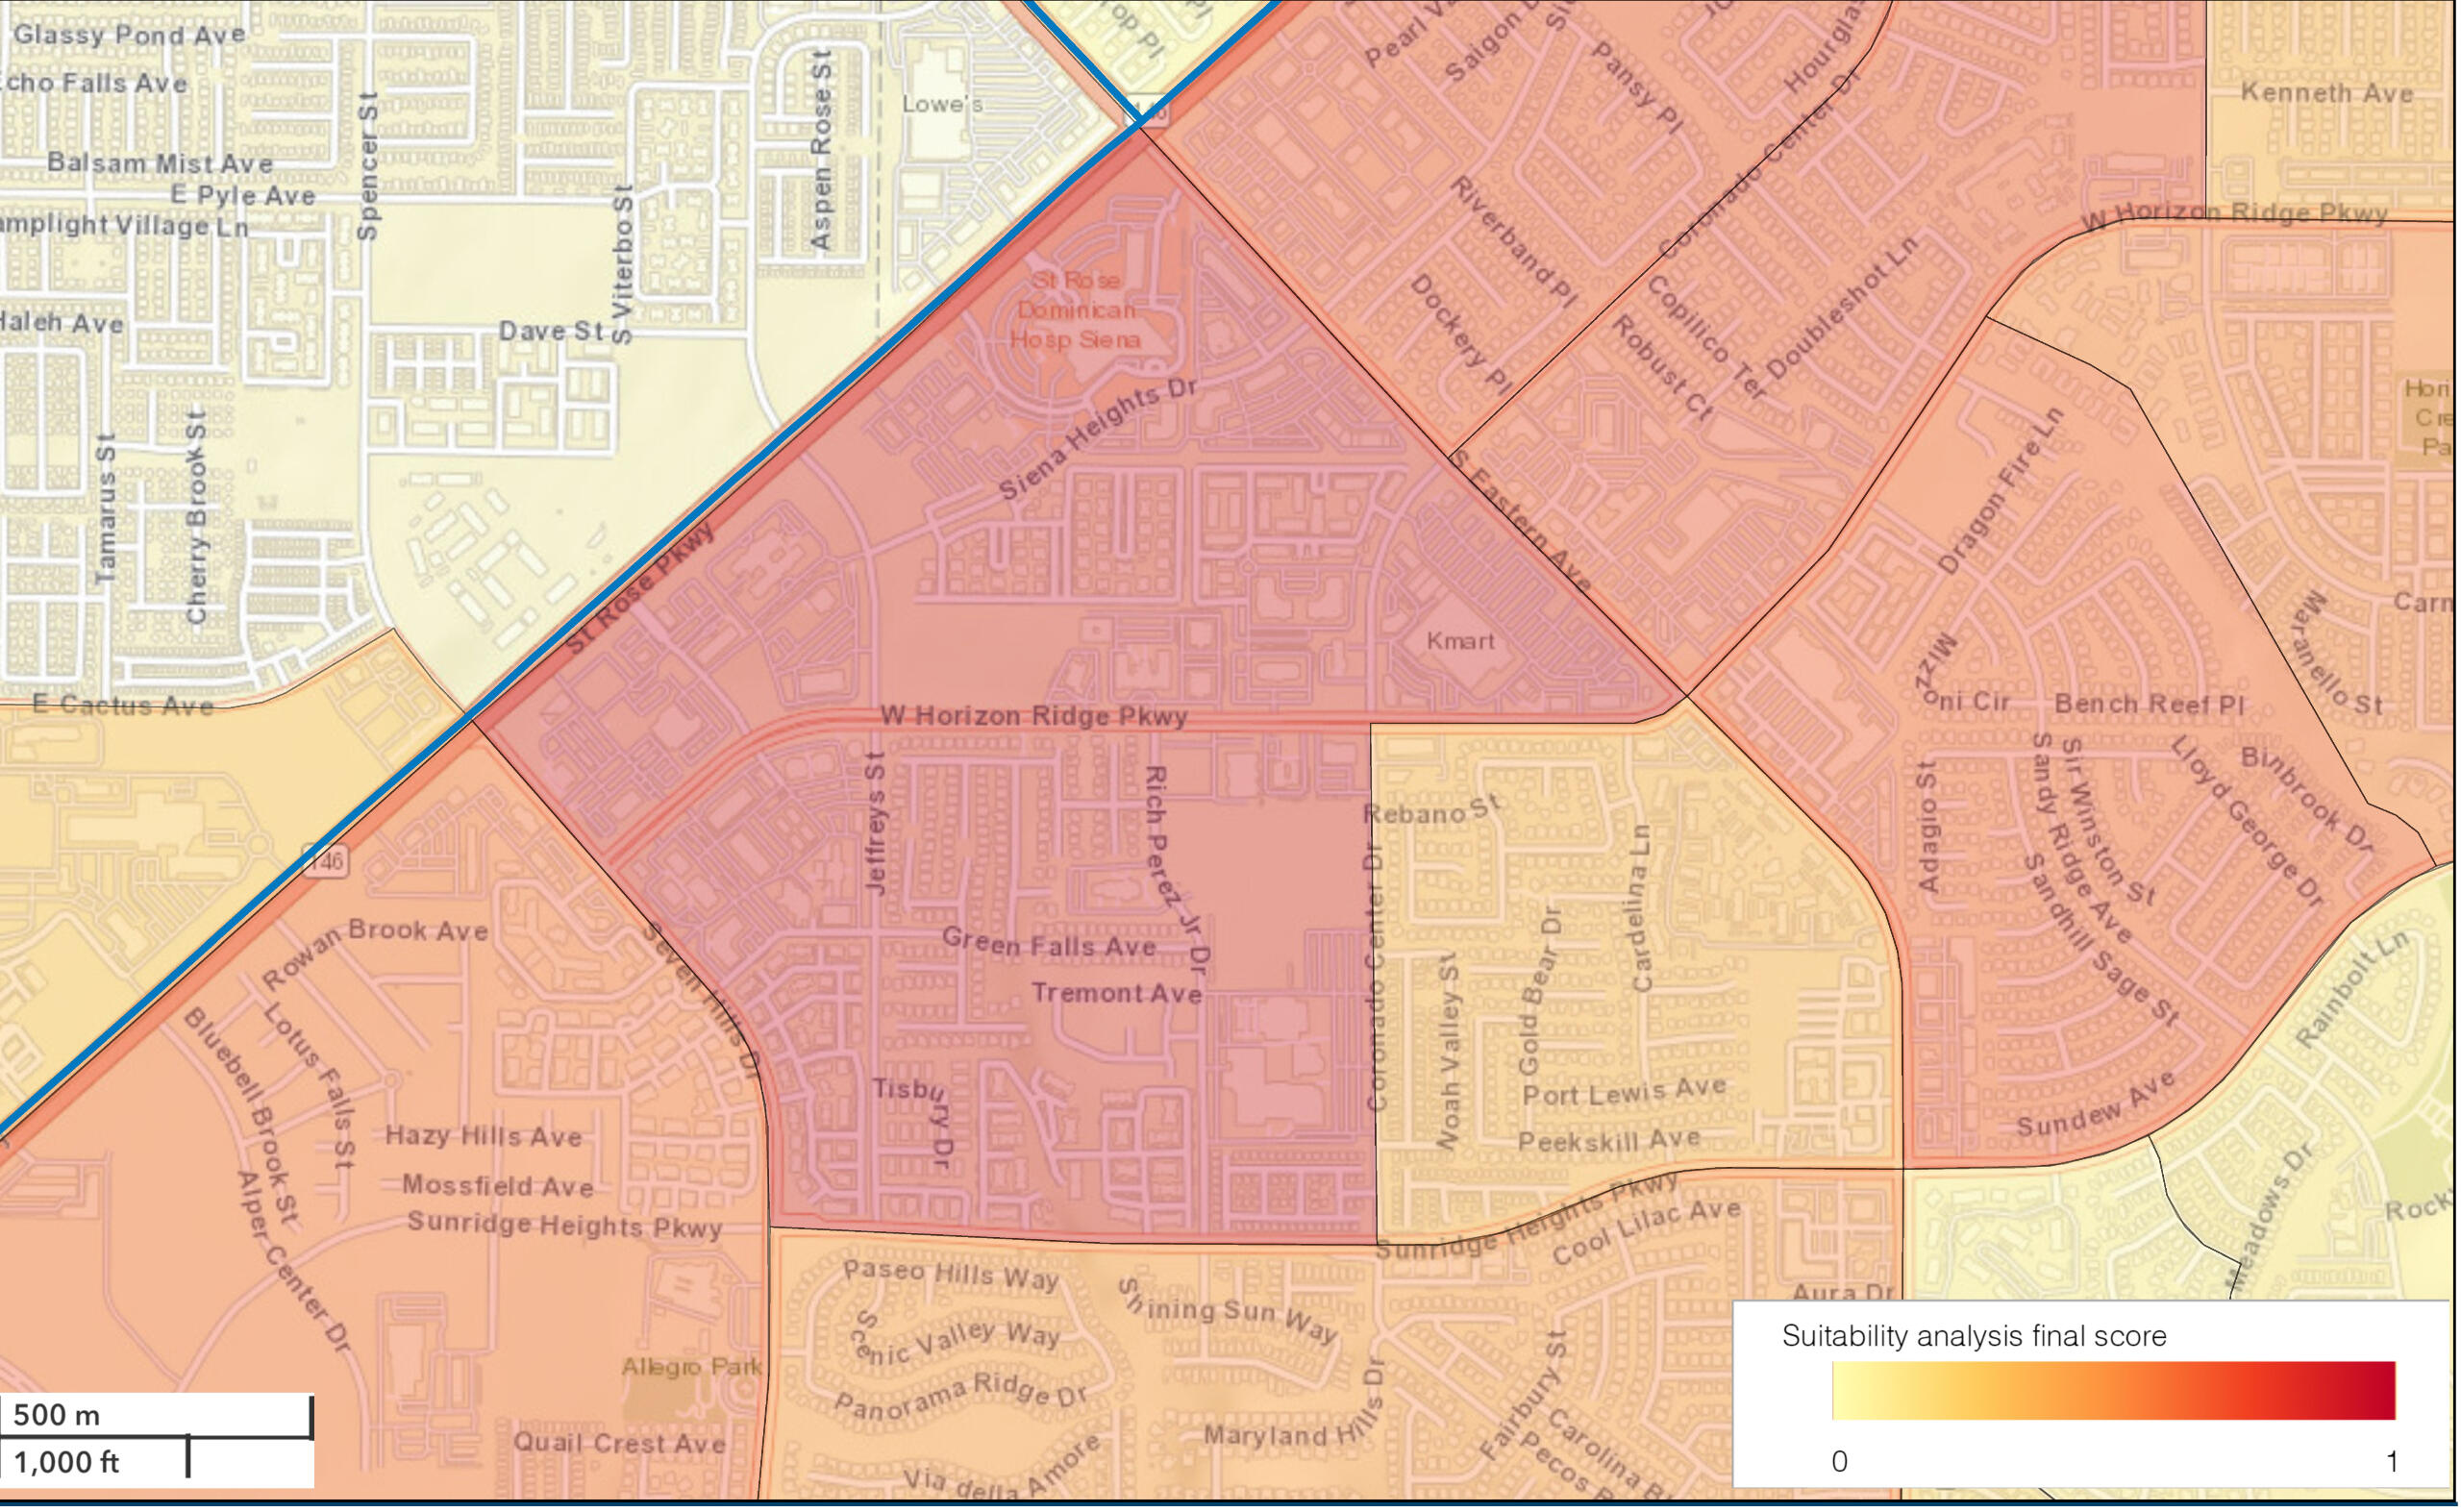
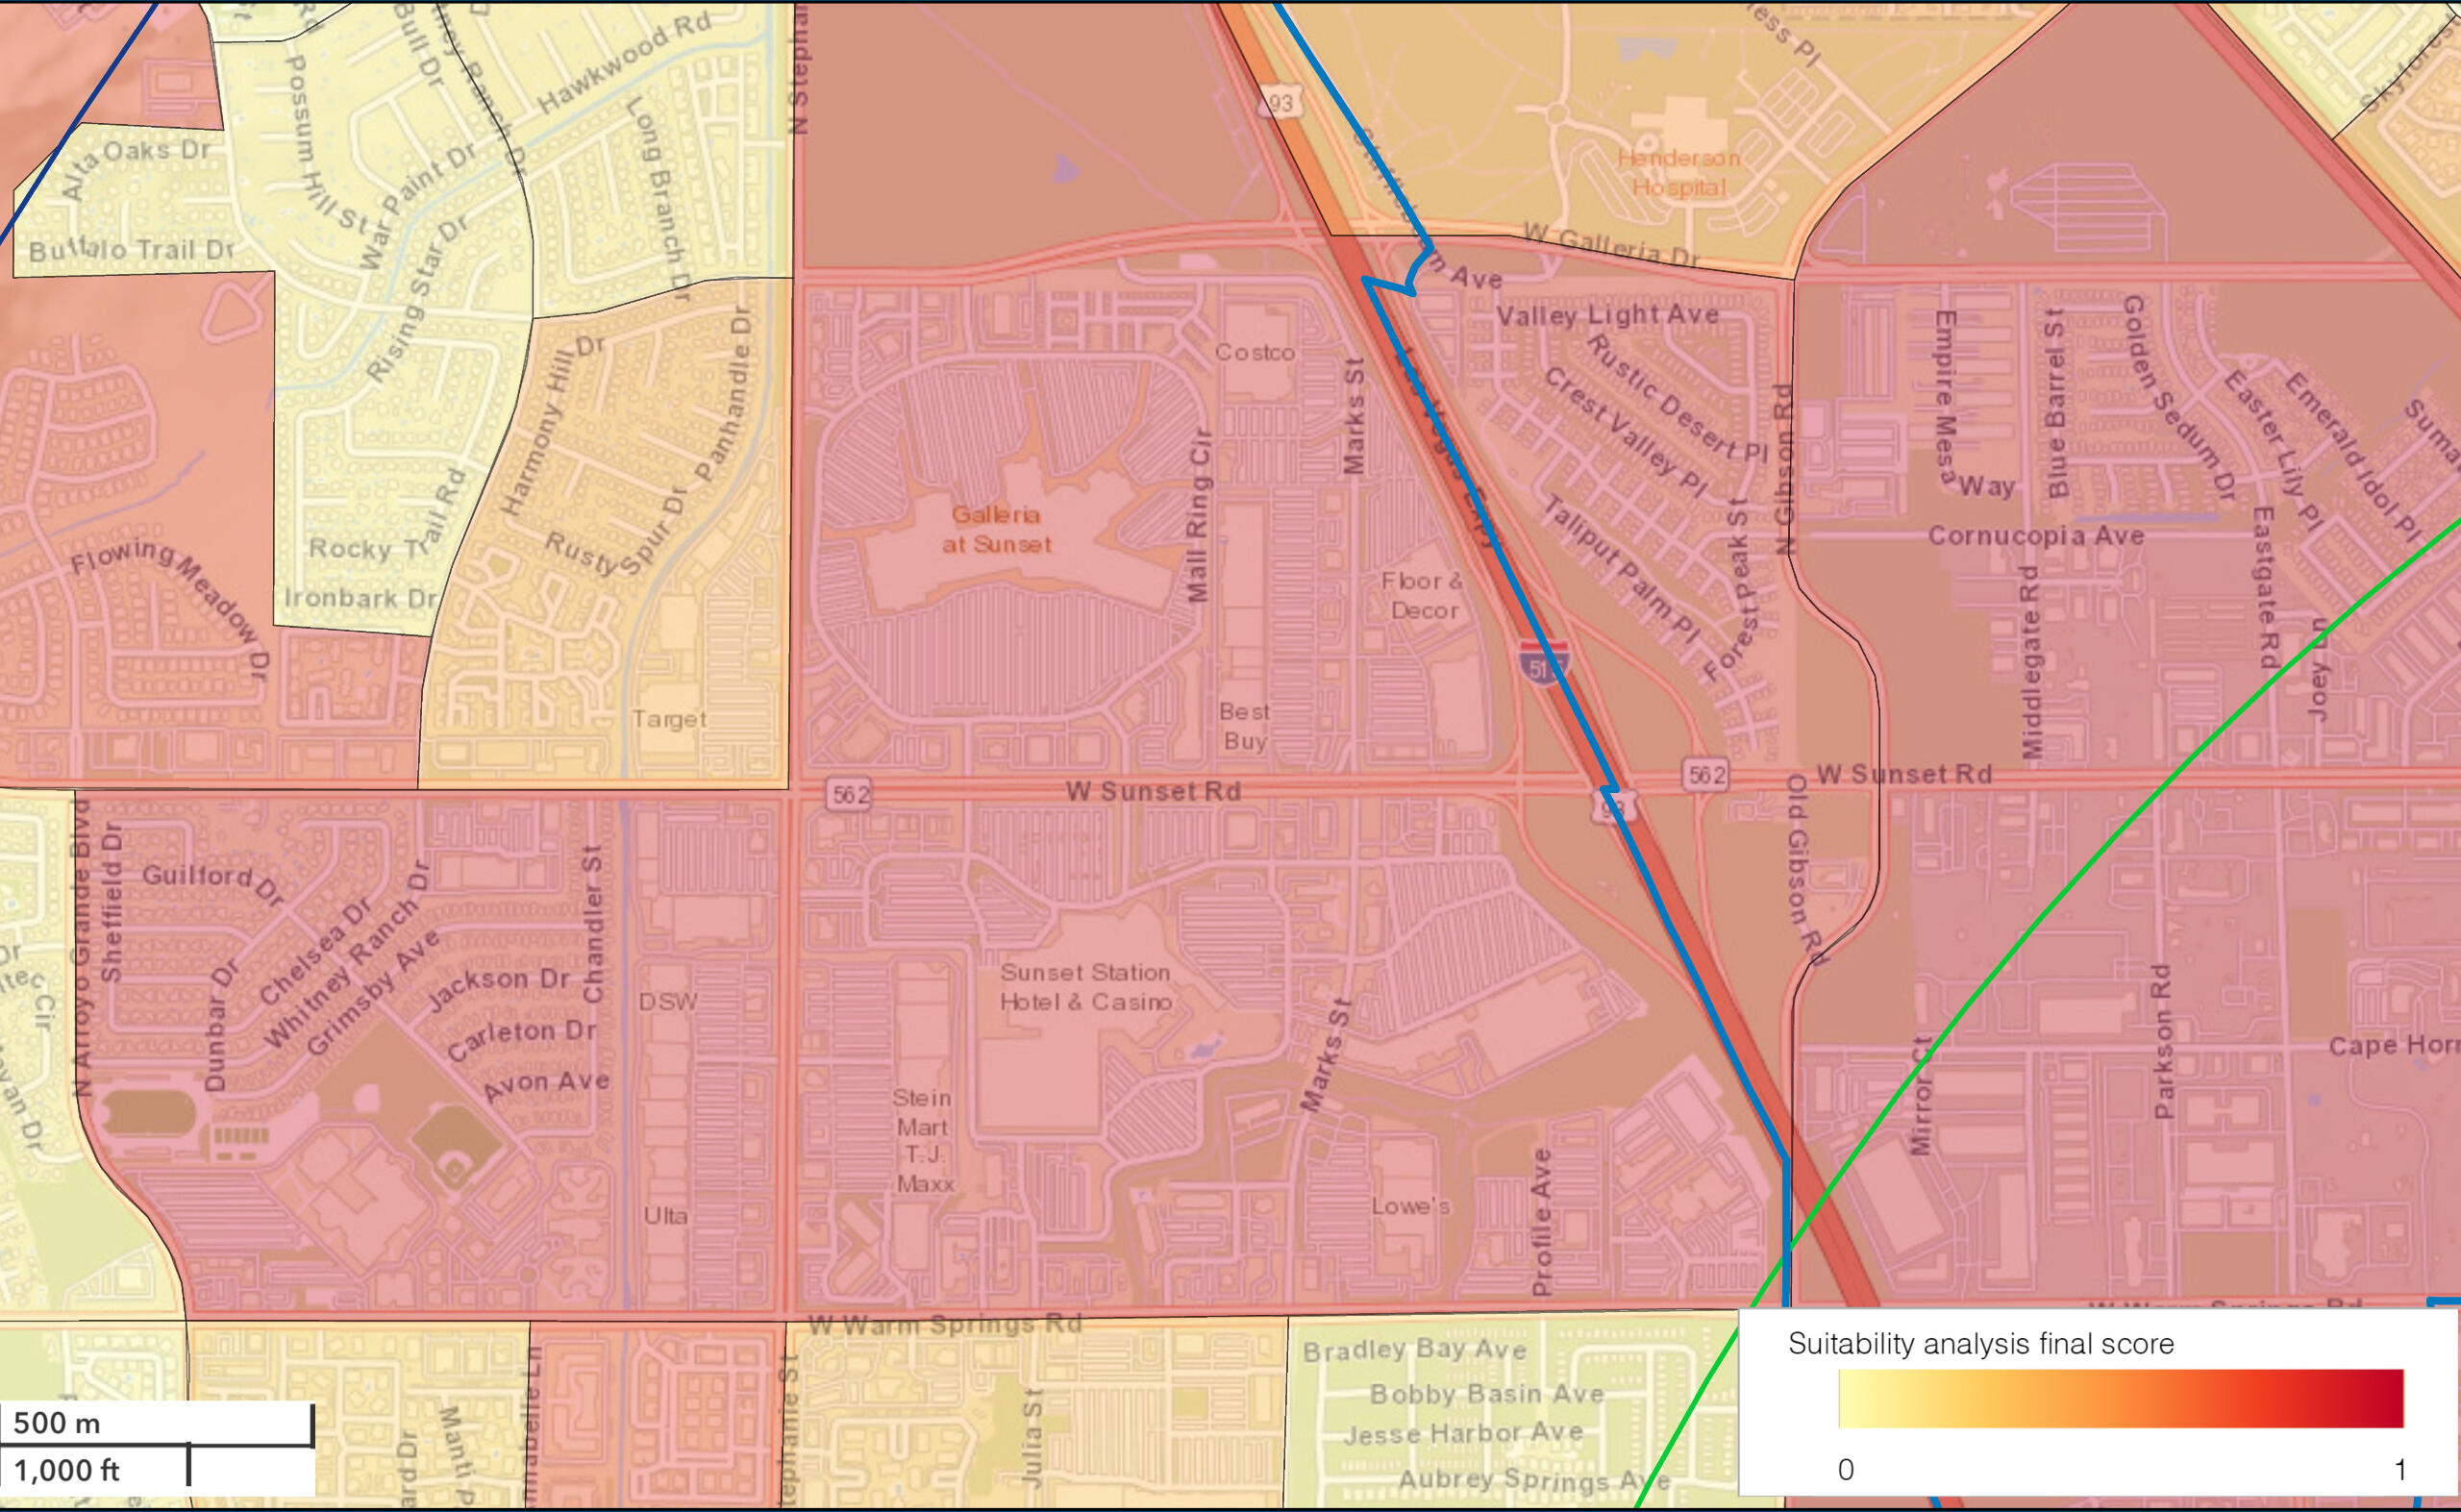
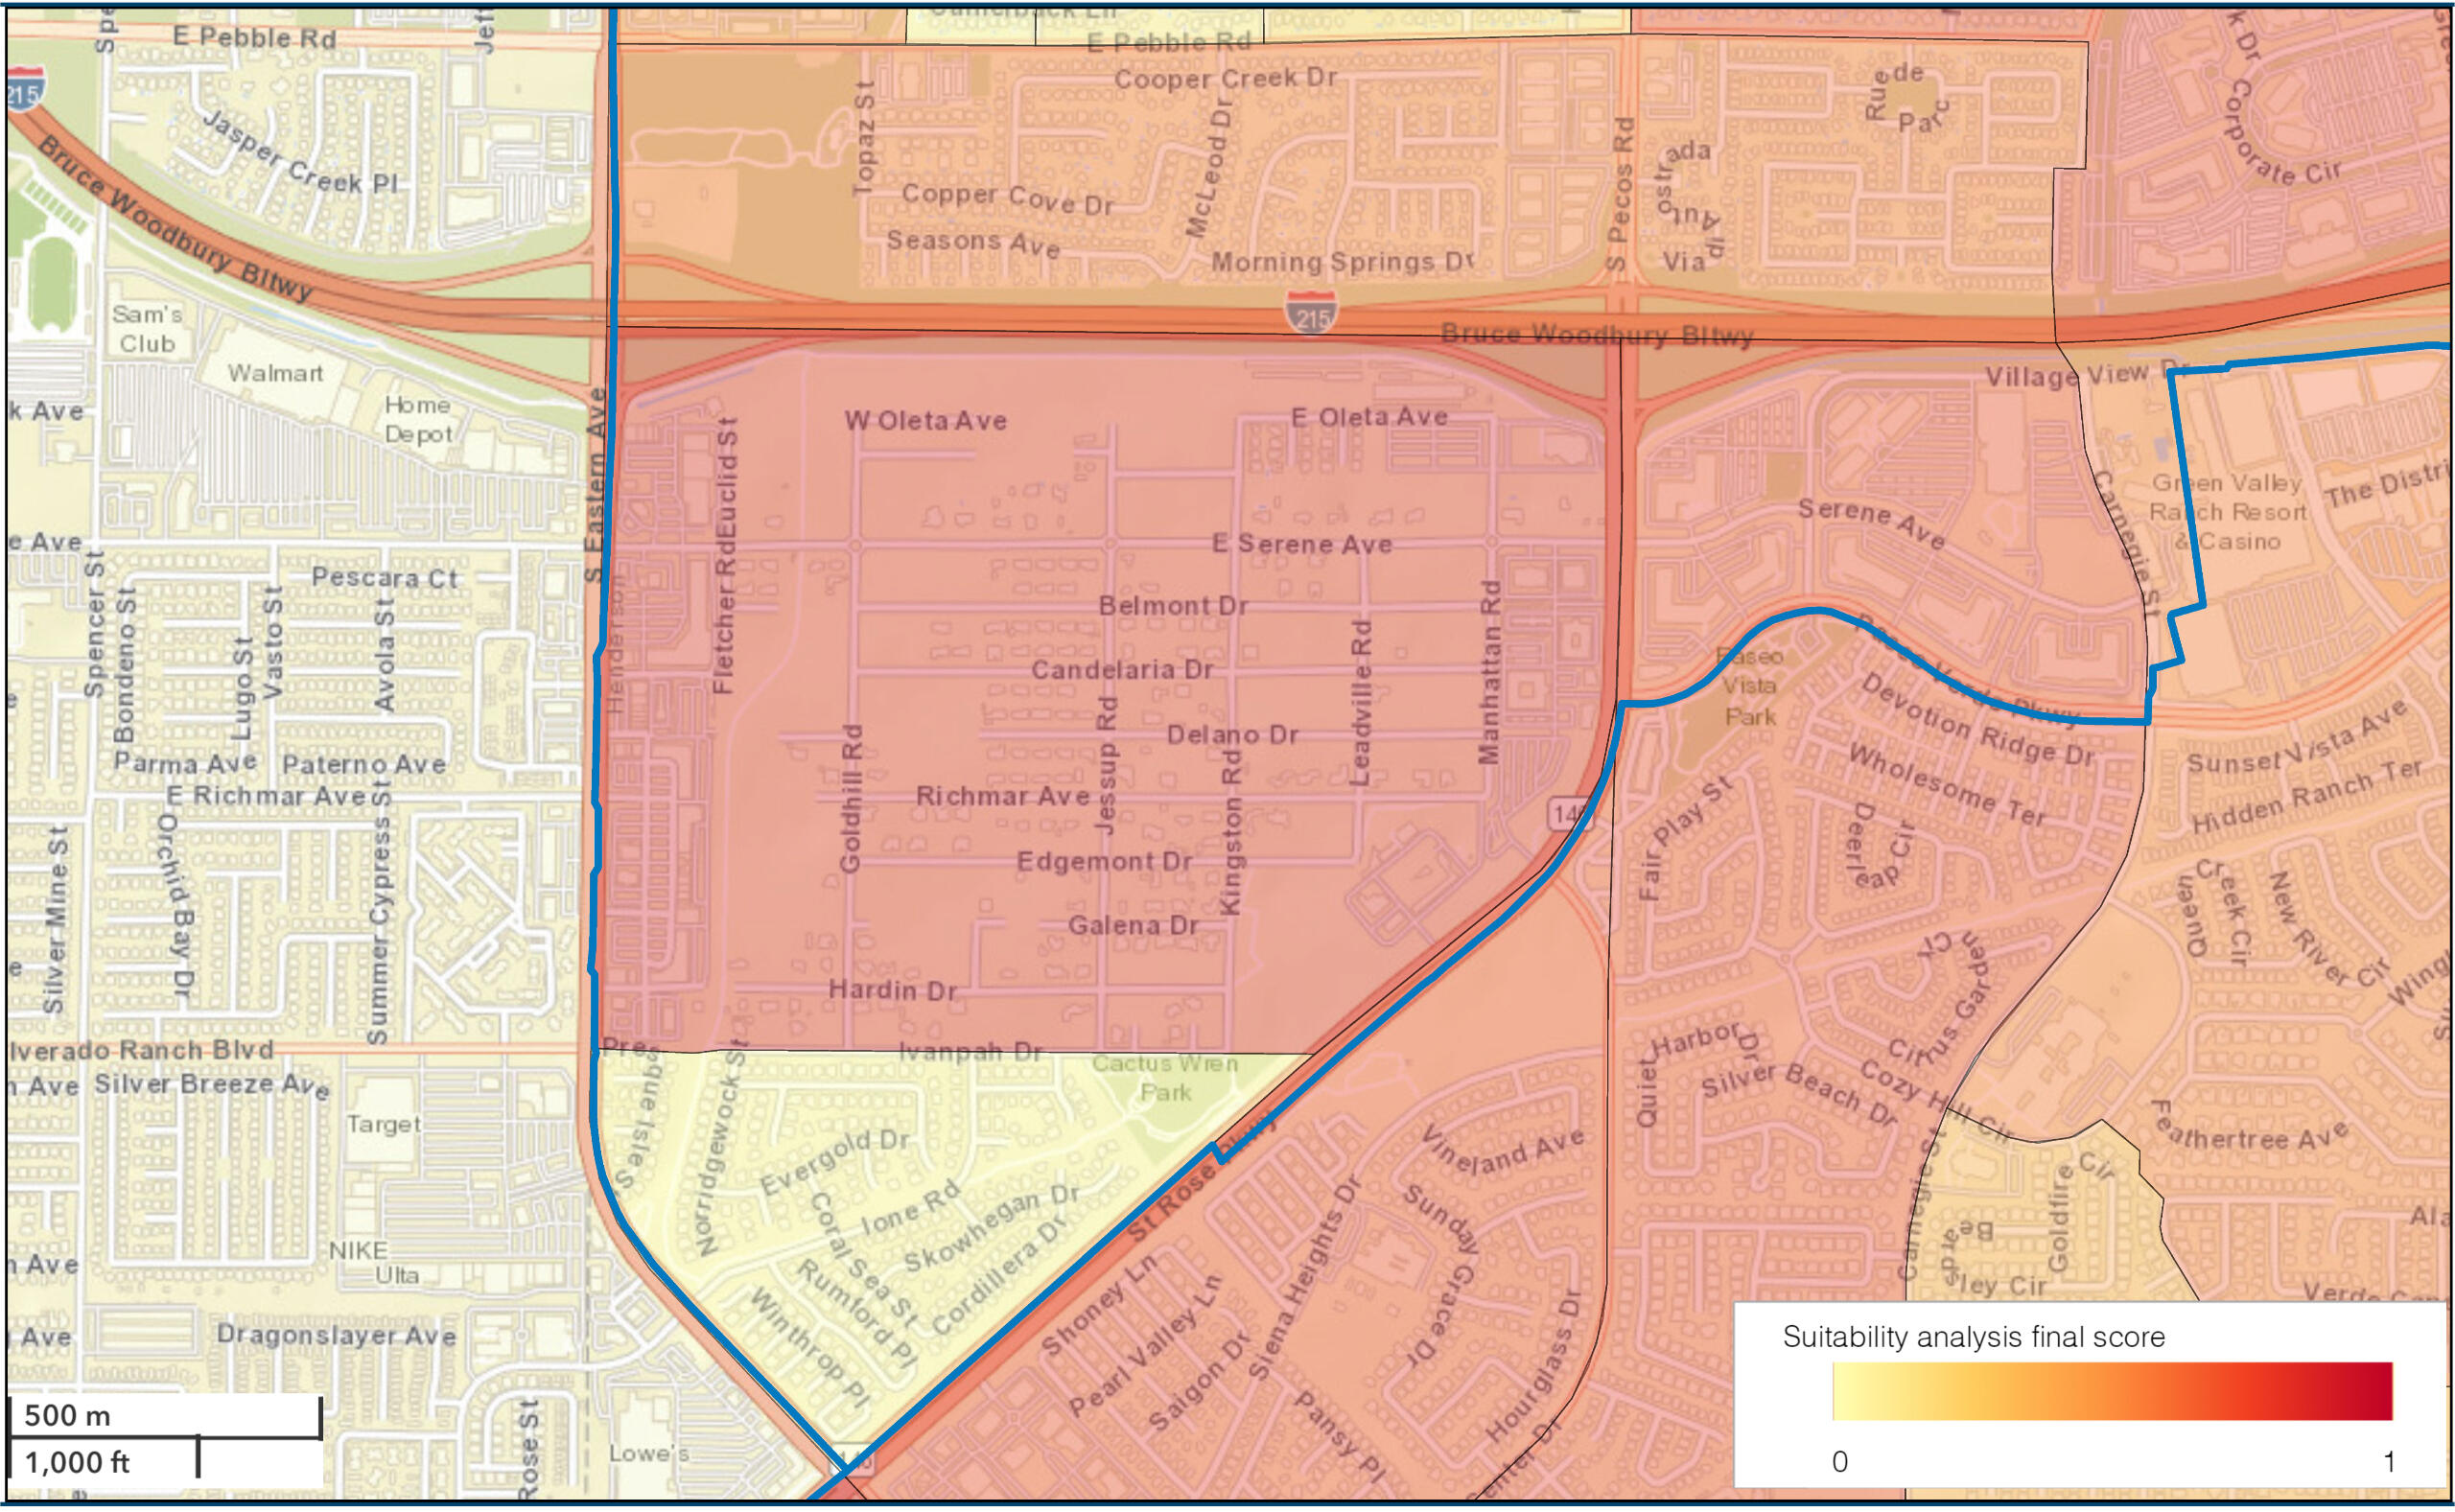
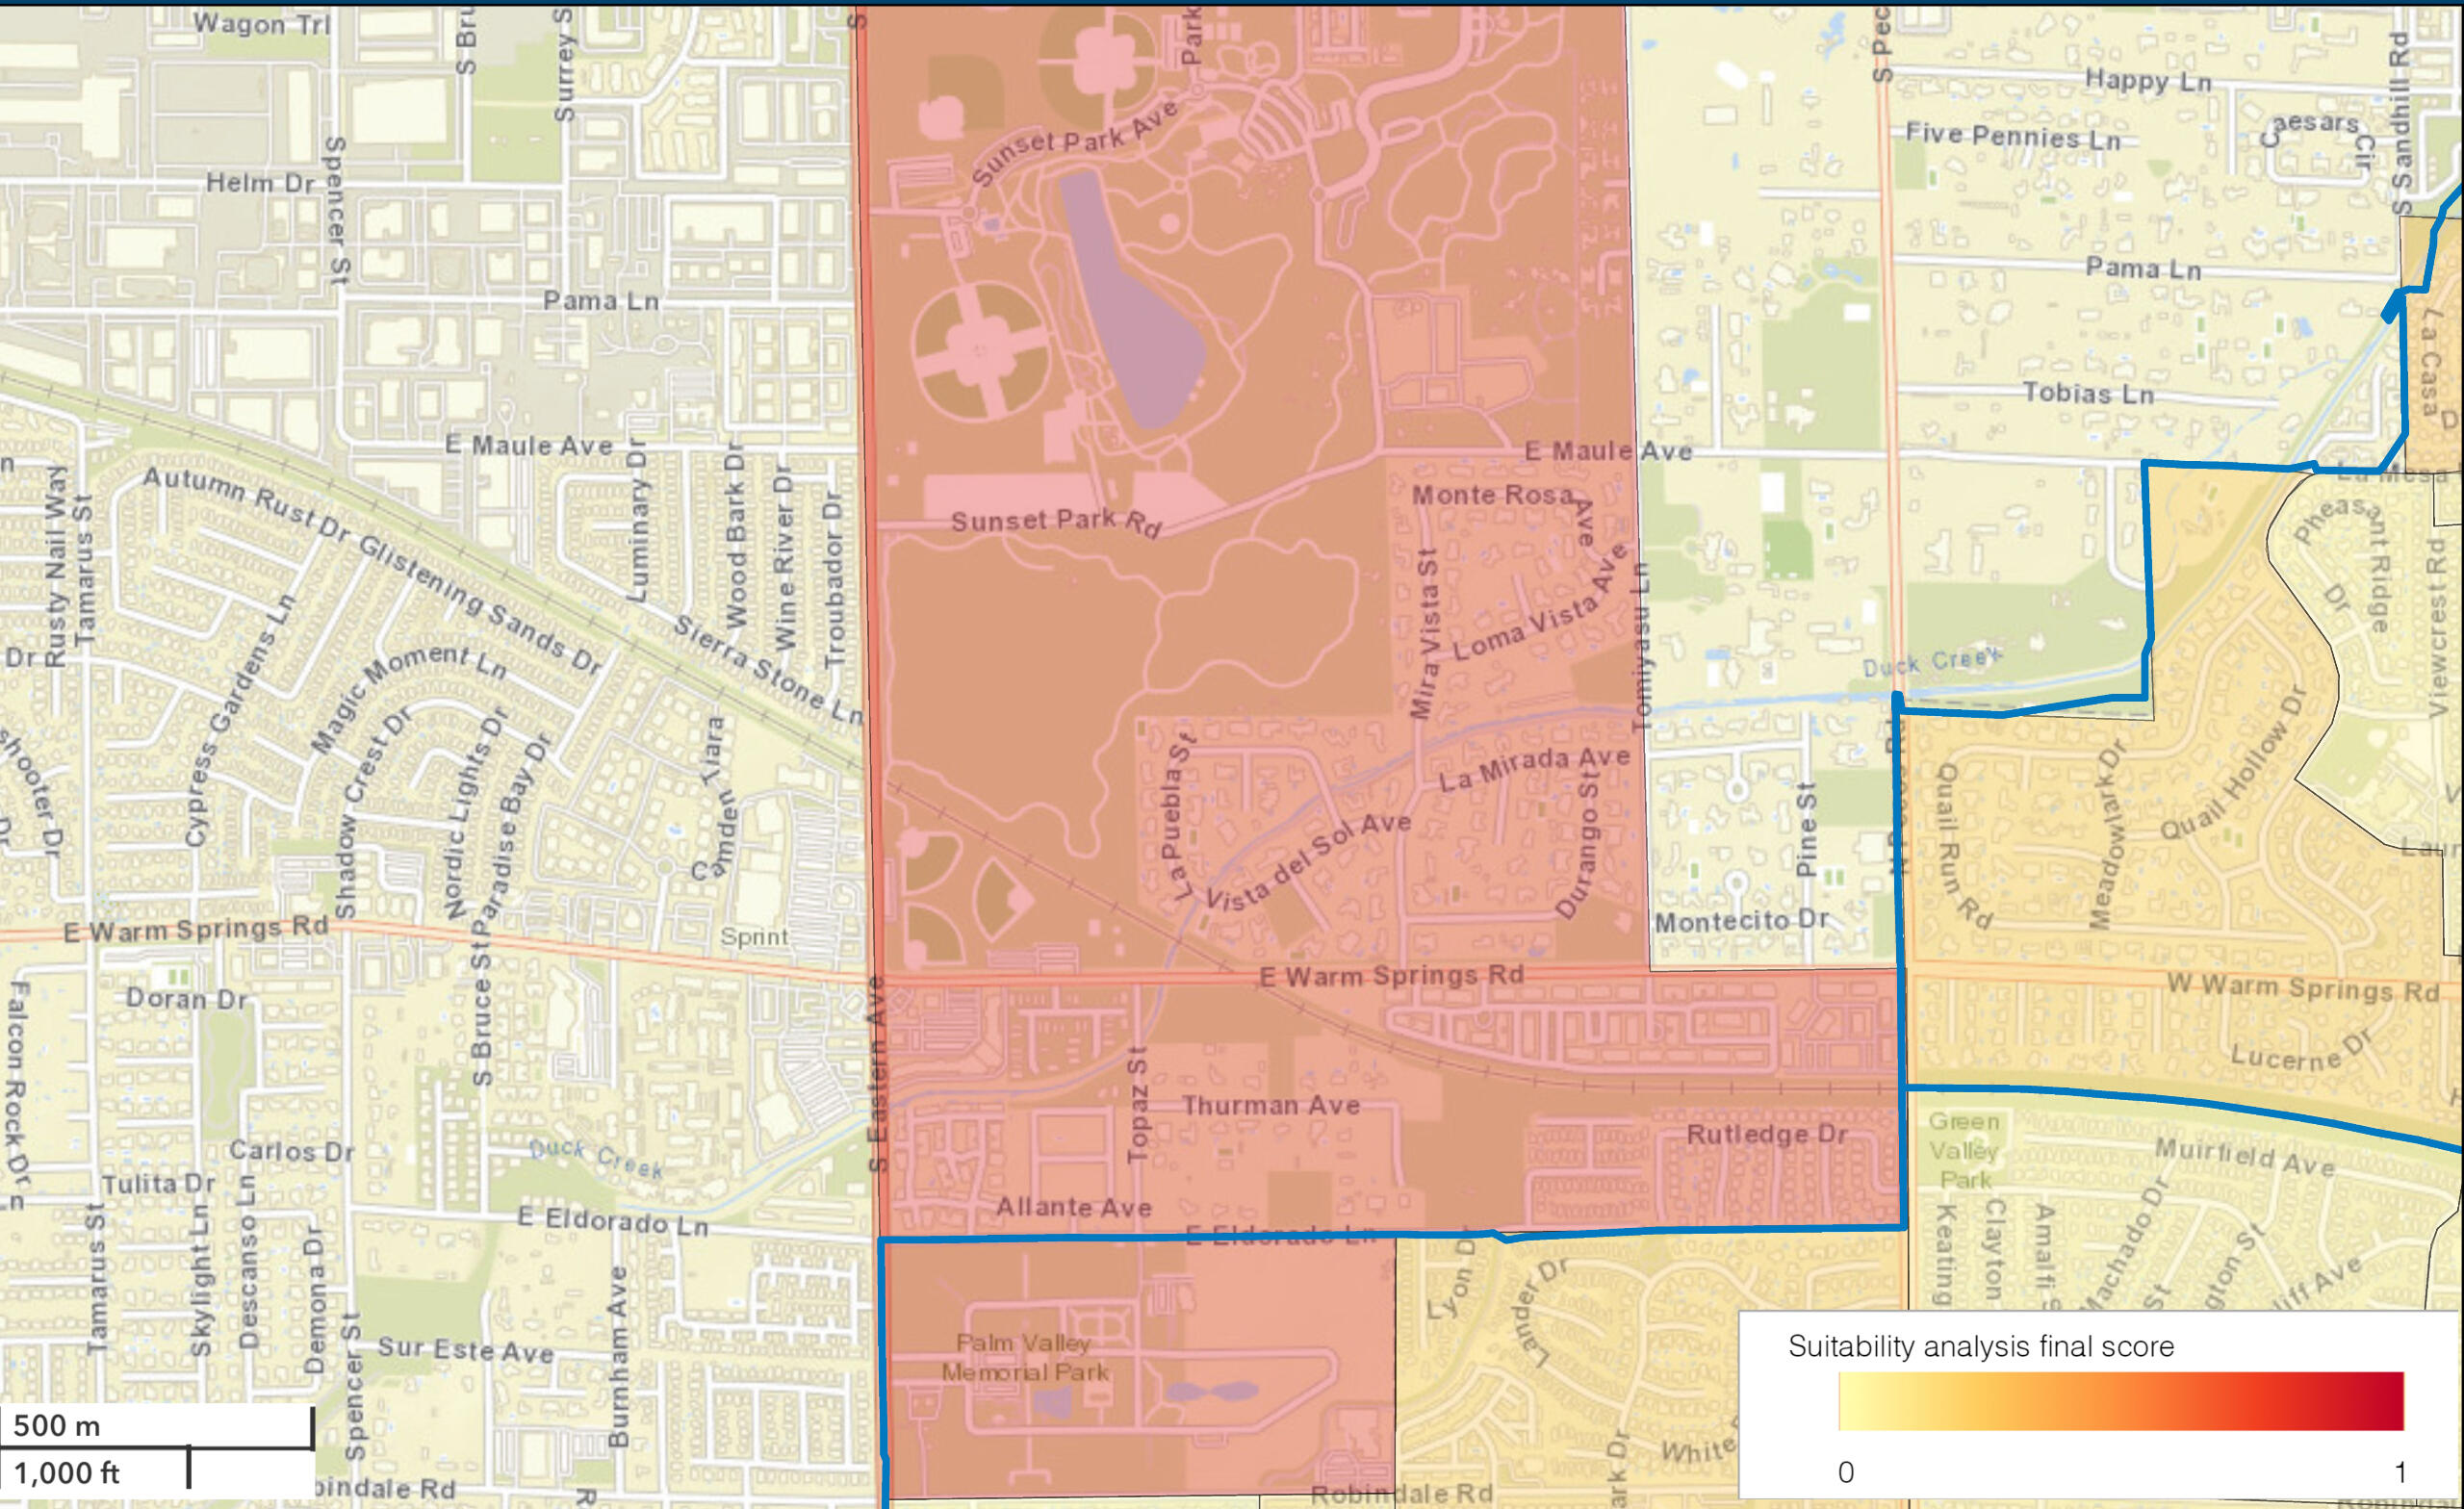
And that rounds out my top five.It’s a short and sweet one today. Next time, I’ll show an analysis I did for a bakery and then a pool service, so you can really see where this all shines
Since schools started up last week for Clark County School District (CCSD), I missed last week’s maps. I decided to do a theme set this go-around.First things first, have to gather the data. I went to the CCSD website and found the addresses for the schools.I split them into Elementary, Middle, and High schools. This meant that I would be able to have different picture markers for the levels.

Crayons for
elementary schools
Notebook for
middle schools
Laptops for
high schools
(all icons purchased from depositphotos)Once I had the data, I cleaned it up like usual. Annoyingly, everything was smashed together. It took a few hours to split everything apart and rearrange it into some semblance of good data.I popped it into my map and geocoded it.Here’s every regular school in CCSD (in both light and dark modes)
Next, here’s the Elementary Schools
Middle Schools
And High Schools
Since I primarily work in the Las Vegas Valley, I zoomed into the area
Starting off with Kindergarten – Fifth Grade
Sixth to Eighth grades
And then Ninth to Twelfth grades
I was debating on putting the colleges and charter schools on here but decided against it. I wanted to stick with the CCSD only schools. Another thing I could have done is added which schools are magnet schools (schools with extra intensive classes).That’s all for this week! Have a good school year and luck to all of the students in getting good grades this year!
August 07, 2024I needed something easier to do today, since my oldest is starting kindergarten this week.I decided on an assessor parcel map. These are used for businesses to get through the planning commission process for the different jurisdictions.
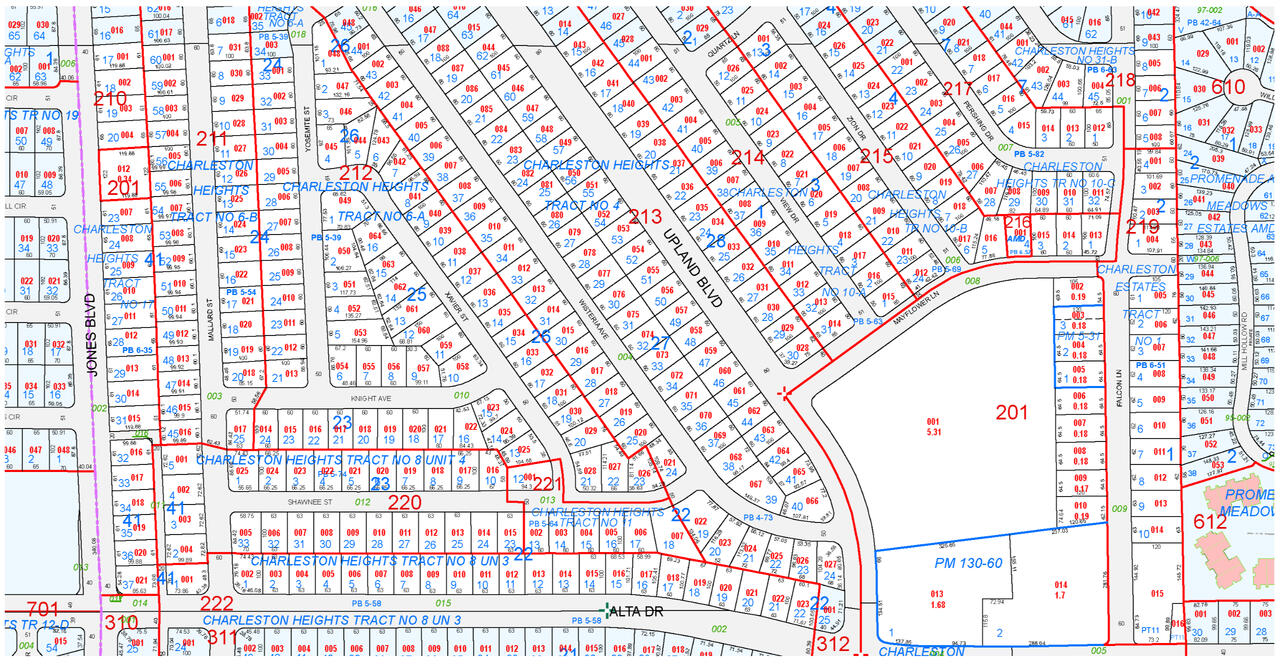
I based the map around my official business address, although I’m technically a home-based business.The map shows the Assessor Parcel Numbers (APNs) for every parcel in the area. It also shows the dimensions of each parcel.If you need to verify this information, I suggest getting a professional surveyor. They are legally responsible for their surveys and are licensed in the state of Nevada.Now, if we narrow down to my APN for my business address, 138-36-210-001, you’ll find the exact location of the office. I’ve starred it below.
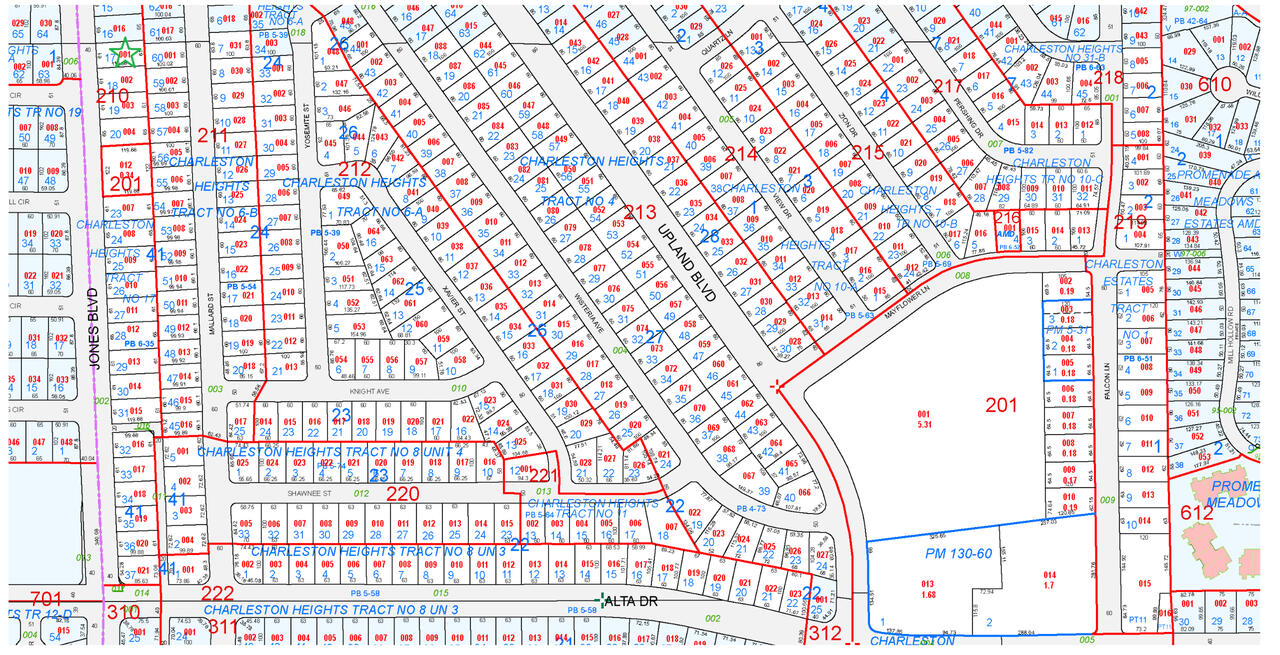
Now, there’s also the ability to sift through the parcel trees, when you need to go back into the history of a parcel number.There’s a parent parcel (what the parcel numbers used to be before it was split)

Then the child parcels based on those parcel splits

Now, you can see that the parcel owner is PPH Holdings LLC. Let’s do a dive into their information.
This is all public information, so I promise that I’m not breaking any laws. And if PPH Holdings LLC requests removal of this information, I will do as they ask (it’s the polite thing to do).
July 31, 2024Going to the Chapel, and I’m going to get maaaaAAAAAAaaaried!Today, I wanted to make a bullseye map with wedding chapels in the Las Vegas Valley.First, I found the Marriage Bureau, since that’s the first step on getting married in Clark County.As usual, I went to the four jurisdictions’ business license departments and only pulled the “Wedding Chapel” ones.Disclaimer: I only used wedding chapels that have active business licenses labelled as “Wedding Chapel” on file between the four jurisdictions. This means that places like banquet halls and other type of wedding venues that weren’t marked as wedding chapels were excluded.After pulling the licenses, I cleaned up the data as usual. There were a couple licenses for places that closed down (RIP Mirage, Tropicana, and Texas Station), but since their licenses are active, they were out onto the map.I removed duplicate addresses, since there’s places under multiple names. Since this is a bullseye map versus a heat map, I didn’t need to have the extra addresses to add weight to the heat.This time, I wanted to hand georeference the points, instead of doing a mass upload. It took a little bit, but since there’s only like 90-ish points, it wasn’t too bad.I uploaded the excel file and joined it with my point data to make it a single layer.Then, I added a 1-, 3-, and 5-mile radius to the map. I made four maps with the full extent then the radii maps.For the layout, I chose to keep everything on the same page, although, if I was presenting this to a client, each map would have its own page.As you can see, there’s a LOT of wedding chapels near the Marriage Bureau. This makes it easy for the weekend eloper to get their marriage license, then see an officiant at a chapel to sign off on the license.I made a light mode and dark mode, since people prefer having a choice between bright lights and neon nights.
These maps took about 90 minutes to make for a medium-low research set with <100 data points.
July 24, 2024We're Officially Open!Thanks to the Urban Chamber of Commerce of Las Vegas and their Capital Readiness Program for helping us get our business license! We're officially open for business!

July 17, 2024Food Deserts
I wanted to work on a project to see how long it would take me to create a map from start to finish. I chose to do a food desert map set for the Las Vegas Valley. The maps are within the post for portfolio purposes.First, I gathered the data from the different jurisdictions with my access to their business licenses. I pulled out the convenience stores and grocery stores licenses. A simple export to Excel, and I have the beginnings of a list.Data cleanup and validation were the longest parts of the process.Each jurisdiction has a different way they set up their Excel files. I combined them into a single sheet, then matched the data so that it looked the same. I removed all suites and unit numbers, since they are not needed for this kind of map.I researched each of the businesses to see what they were, since a lot of them were under an LLC name versus the DBA name. This was the longest thing ever. It must have taken me four of the six hours just to research the data. Some of the businesses needed to be deleted because they weren’t food stores. There were massage parlors, liquor only stores, hotels, and senior homes mixed in.Once that was done, I deleted any duplicates and uploaded to my mapping software.I geocoded the points and created this pair of maps (a light and dark mode):
Next, I deleted some of the data, so that I would only have the convenience points:
Then the grocery only points:
Finally, it became time to create the heat maps. I needed to make sure that I had the color ramp set up for the sparse to be darker than the dense. This means the less points in an area, the redder it will be, showing where there are places where there’s a lack of food resources.I also added a layer of the street centerlines, so that its easier to see the major arterials and freeways.I got to watch this little gerbil run
since the 950-ish data points took up a lot of computing power and made my computer smoke and race.First all of the food stores (grocery and convenience):
Then the convenience stores heat map:
And then the grocery heat maps:
The final picture is the official Census Food Desert Map with the diagonal lines showing census tracts with food desert status
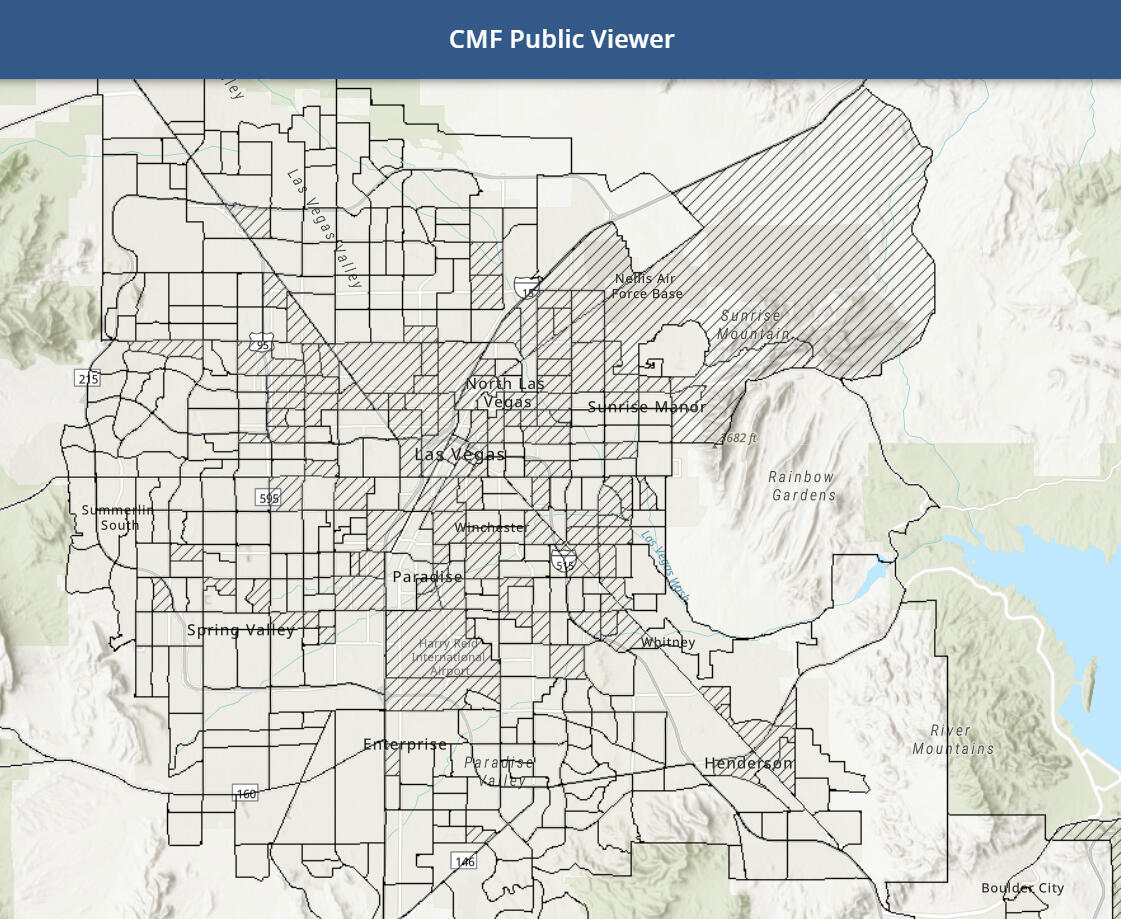
It took 6 hours to make with medium research and almost 1000 data points.
July 10, 2024NV Grow businesses mapped out. Made two different styles for the client, so that they could use what works best for their materialsThese are the businesses that work with the @nvgrow program.If you have a business that:1) makes more than $50,000/year and less than $700,000/year2) has been in business for more than 2 yearsAND3) has a business planI suggest working with NV Grow to expand your business with their various opportunitiesContact NV Grow today! https://nvgrow.org


